Fig. 5.
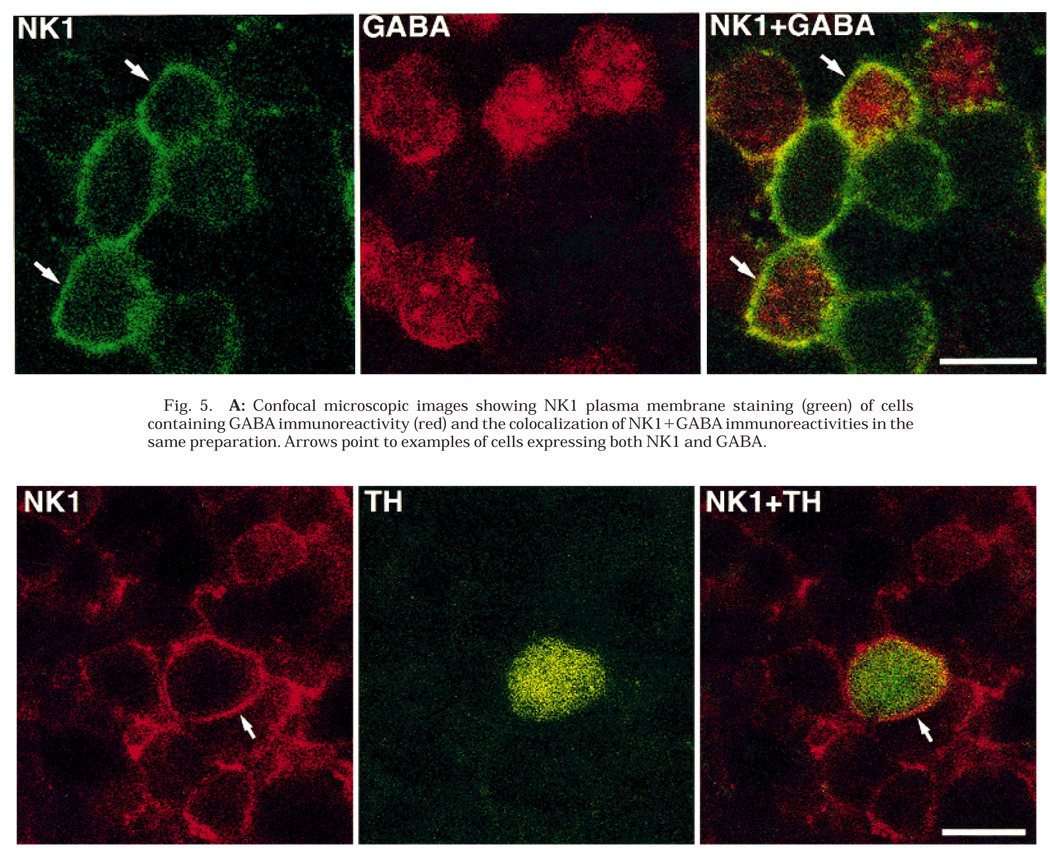
A: Confocal microscopic images showing NK1 plasma membrane staining (green) of cells containing GABA immunoreactivity (red) and the colocalization of NK1 + GABA immunoreactivities in the same preparation. Arrows point to examples of cells expressing both NK1 and GABA.
B: Confocal microscopic images showing NK1 cell surface staining (red) of a cell containing TH immunoreactivity (green) and the colocalization of NK1+TH immunoreactivities in the same preparation. Arrows point to the NK1 cell surface staining. Scale bars = 10 µm.

