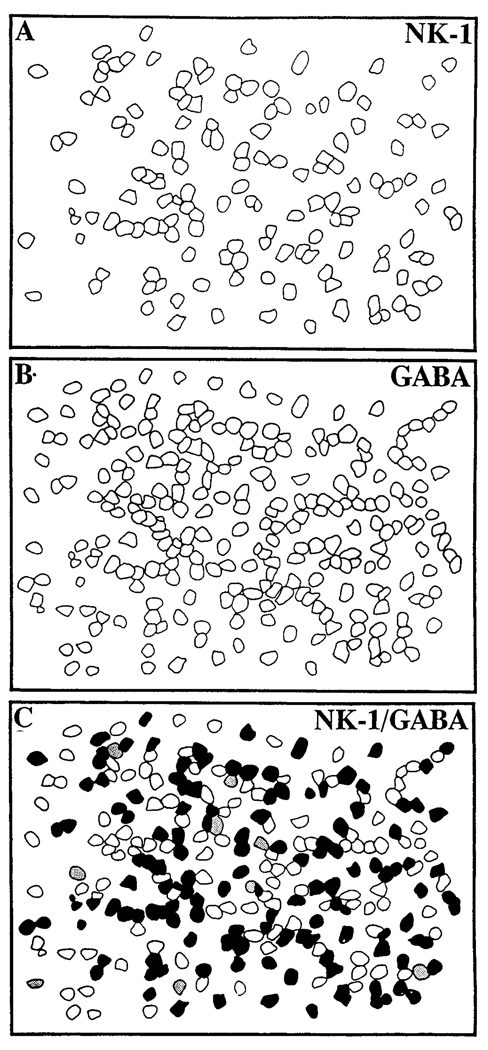
Fig. 6.
Schematic reconstruction made from photographic negatives (T-MAX 400) of NK1- and GABA-IR profiles, respectively. C was obtained by superimposing (A) and (B); filled profiles represent cells displaying both NK1 and GABA immunoreactivities, stippled profiles represent cells only having NK1 immunoreactivity, and open profiles represent cells displaying only GABA immunoreactivity.

