
Figure 4.
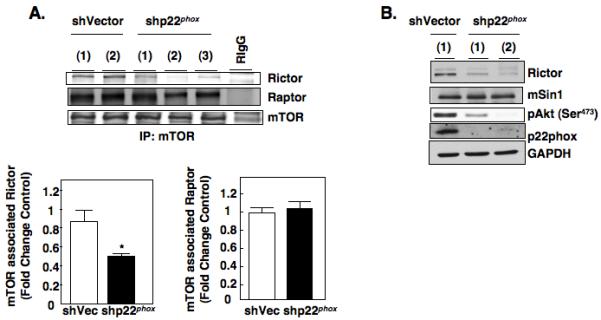
Redox regulation of mTORC complexes. (a): Association of Rictor and Raptor with mTORC complexes were examined in stable shVector or shp22phox RCC 786-O independent single cell clones by immunoprecipitating mTOR with anti-mTOR antibodies or equivalent amounts of rabbit IgG for control from cell lysates prepared in mTOR lysis buffer as described in materials and methods followed by Western blot analysis for Rictor, Raptor, and mTOR. Histogram (lower panel) represents the ratio of the intensity of the Rictor or Raptor bands to the mTOR band in shp22phox knock down clones compared to vector controls (Fold change control) quantified by densitometry. Values are the means ± S.E. (n =3), * p<0.05. (b): Cellular lysates were prepared from stable shVector or shp22phox RCC 786-O independent single cell clones and analyzed by Western blot analysis for Rictor, mSin1, pAkt473, and p22phox expression. GAPDH was used as a loading control.