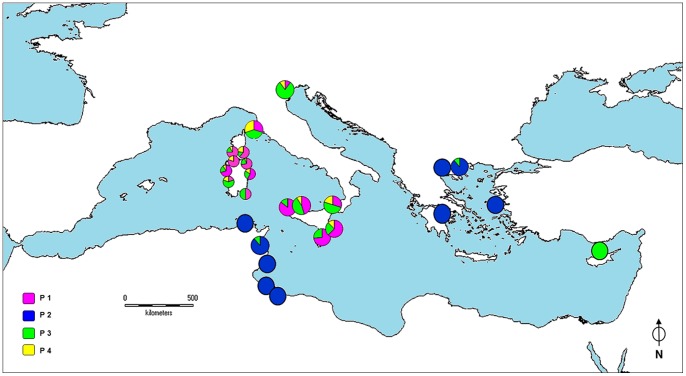
Figure 2. COI dataset: Bayesian cluster distribution.
Frequency distribution of the four groups of haplotypes P1, P2, P3, and P4, as evidenced by Bayesian analysis over the Mediterranean map. Due to the high number of populations, the size of the pie charts in the Sardinian-Corsican region was reduced, and the relative populations were merged in three distinct groups as reported below. North-western Sardinia group includes Baia di Porto Conte-BPC, Torre del Porticciolo-POR, Lazzaretto-LAZ, Ospedale Marino-OSM; central-eastern Sardinia group includes Molara-MOL, Capo Ceraso-CCE, Le Saline-SAL, Monte Petrosu-MPE, Porto Ottiolu-OTT; central-western Sardinia group includes Oristano-ORI, Marceddì-MAR, Isola di Mal di Ventre-IMV.

