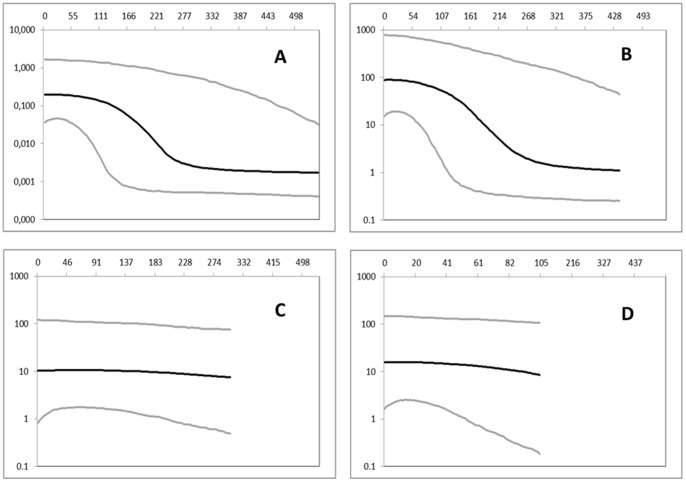
Figure 5. COI dataset: Bayesian skyline plots.
Bayesian skyline plots depicting the demographic history of Pinna nobilis. The effective population size (y-axis) is shown as a function of time (x-axis), with the units expressed as KYR (1,000 years). (A) entire dataset, (B) the regional group encompassing the Sardinian-Corsican region, Elba Island, and Sicily, (C) the Venetian lagoon and (D) the Aegean Sea and Tunisian coasts. The black lines denote the median population estimates, and the grey lines denote the 95% high posterior density (HPD) confidence limits.

