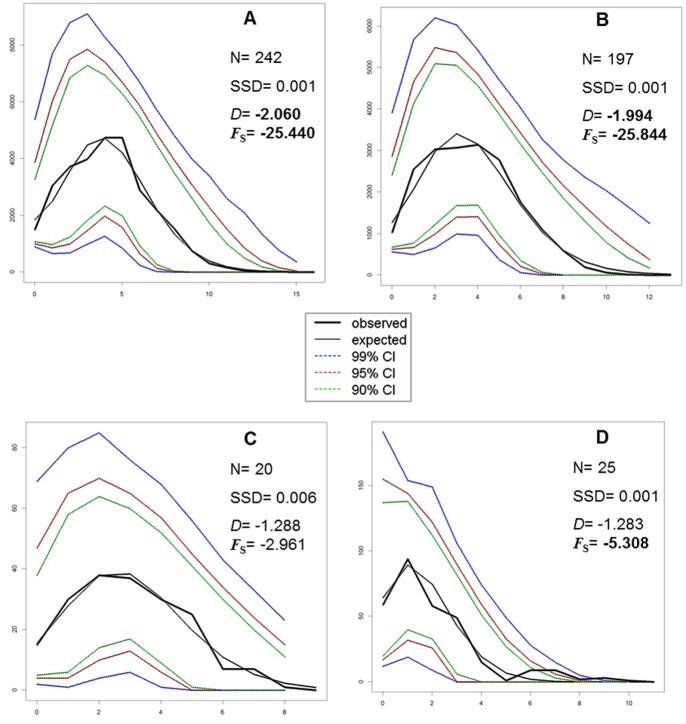
Figure 8. COI-16S dataset: mismatch analysis.
Graphs of the mismatch distributions of (A) the entire sample, (B) Sardinia, Corsica, Elba Island, and Sicily, (C) the Venetian Lagoon and (D) the Aegean Sea. The x axis reports the observed distribution of pairwise nucleotide differences, and the y axis reports the frequencies. N, sample sizes; SSD, sum of squared deviations; D, Tajima’s D value; Fs, Fu’s F value. The significant values are given in bold.

