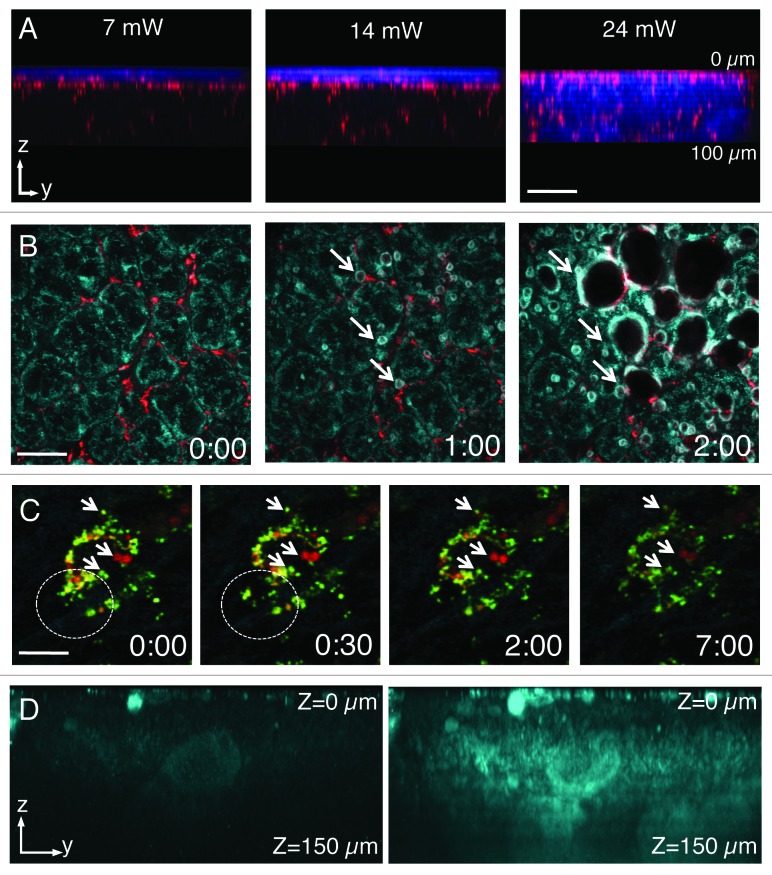
Figure 2. Laser power and detector sensitivity in intravital two-photon microscopy. Anesthetized rats were injected with Hoechst (blue) and Texas red-dextran (red) (A), Texas red–dextran alone (B), Texas Red- and Alexa 488-Dextran (green) (C) or not injected. After 2 h, the salivary glands were exposed and imaged by two-photon microscopy (excitation 750 nm) using a 60x water immersion objective (NA 1.2, Olympus). (A) Salivary glands were imaged by using 3 different laser powers (7 mW, 14mW and 24 mW, as measured at the objective). Dextran was internalized by stromal cells (red) and Hoechst labeled the nuclei (blue). Bar, 50 µm. (B and C) Salivary glands were imaged using two laser powers: 30 mW (B) and 15 mW (C). (B) Excitation of endogenous fluorescence reveals the parenchyma (cyan) whereas stromal cells are highlighted by internalized dextran (red). After 1 min, the tissue shows signs of photodamage (arrows) and around 2 min is completely disrupted (Vid. S1) Bar, 40 µm. (C) Internalized dextrans are localized in two different endosomal populations within stromal cells and exhibit high mobility within the first 30 sec (see area within dotted circles). Endosomal mobility is suddenly stopped after 1–2 min from the beginning of the imaging session (Vid. S2) Note also that photobleaching occurred (right panel). Bar 10 µm. (D) Z-scan of unstained salivary glands by using a conventional multialkali detector (left panel) or GaAS detector (right panel).

An official website of the United States government
Here's how you know
Official websites use .gov
A
.gov website belongs to an official
government organization in the United States.
Secure .gov websites use HTTPS
A lock (
) or https:// means you've safely
connected to the .gov website. Share sensitive
information only on official, secure websites.
