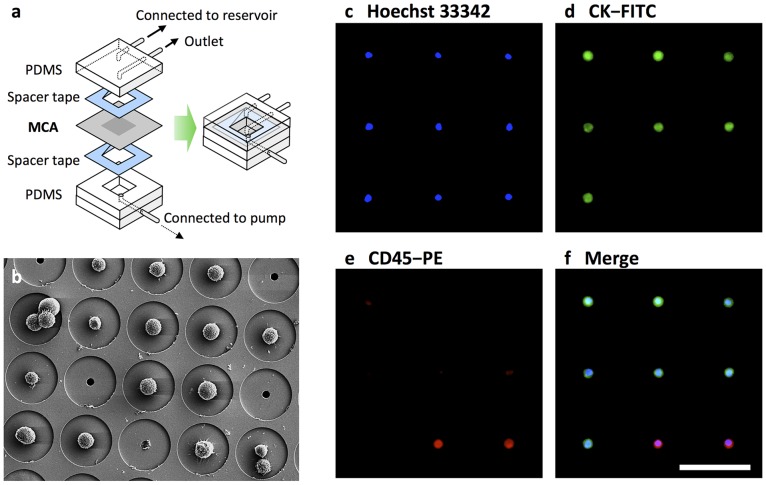
Figure 1. MCA system for size-based isolation of CTCs.
(a) Schematic diagram of the structure of the MCA system. (b) Scanning electron microscope image of a cultured tumor cell line trapped on the MCA system. (c–f) Cells isolated from SCLC patient blood stained with Hoechst 33342 (c) and fluorescent-labeled antibodies that target cytokeratin (d) and CD45 (e). Merging of the images (f) allowed for identification of CTCs and hematologic cells. Scale bar = 60 µm.

