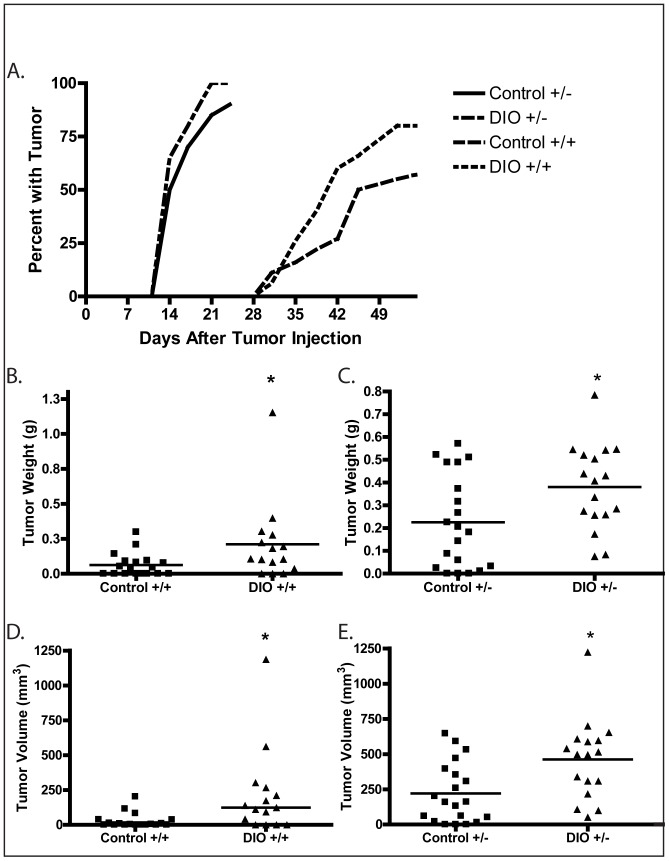
Figure 3. Effect of p53 gene dosage and a DIO regimen versus a control diet on Wnt-1 mammary tumor growth.
A, the percentage of mice with palpable Wnt-1 mammary tumors after tumor cell injection in response to a control diet or DIO regimen, (n = 20 per group). Wnt-1 p53+/+ and Wnt-1 p53+/− final tumor weights are shown in B and C, respectively, and Wnt-1 p53+/+ and Wnt-1 p53+/− final tumor volumes are shown in D and E, respectively (means indicated by horizontal lines). Significant differences are indicated by an asterisk; P≤0.05.

