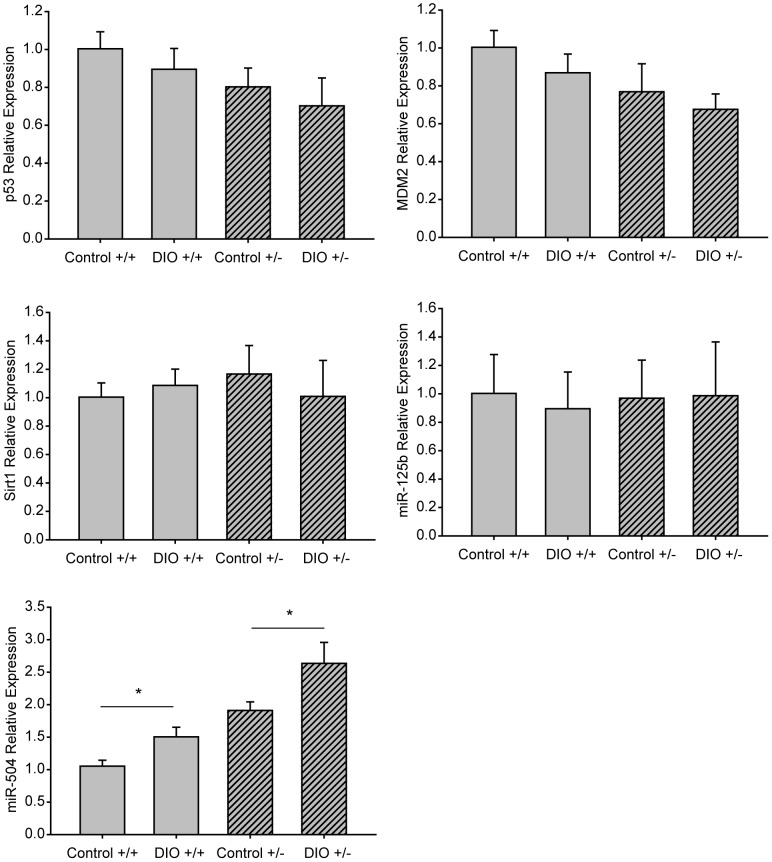
Figure 6. Effect of p53 gene dosage and a DIO regimen versus a control diet on Wnt-1 mammary tumor gene expression of p53 and its regulators.
mRNA expression, measured by quantitative real-time PCR, of p53, mouse double minute (MDM2), Sirtuin (Sirt)1, microRNA (miR)-125b and miR-504 (n = 5 per gene per group; 3 replicates) in Wnt-1 p53+/+ and Wnt-1 p53+/− tumor tissue from DIO or control mice. Data are presented as gene expression relative to that in Wnt-1 p53+/+ tumors from control mice (means ± SD). Significant differences are indicated by an asterisk; P≤0.05. miR-125b data was natural log transformed to meet statistical test assumptions.

