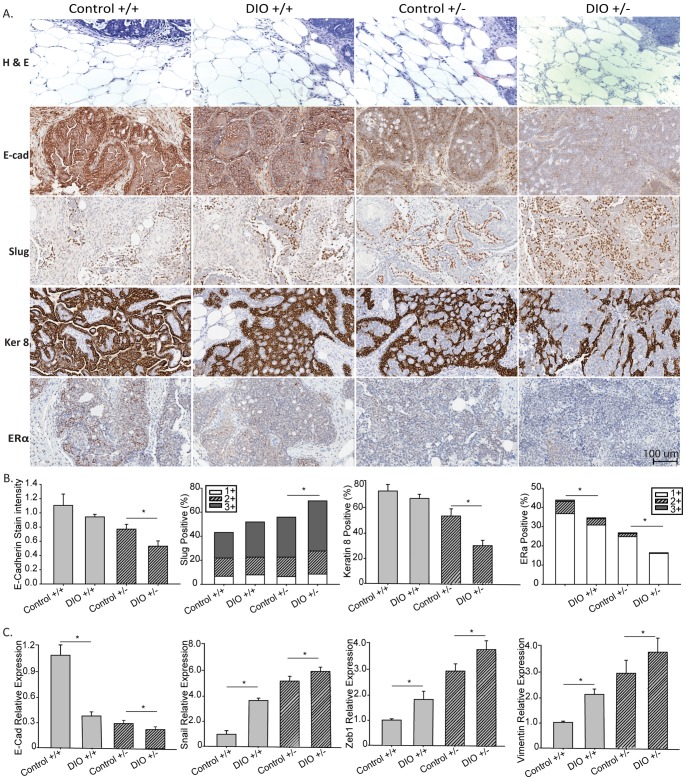
Figure 7. Effect of p53 gene dosage and a DIO regimen versus a control diet on Wnt-1 mammary tumor on invasive markers and ERα expression.
A, representative hematoxylin and eosin images (n = 11–20; 10–20×) of Wnt-1 p53+/+ and Wnt-1 p53+/− tumors and surrounding mammary fat pads from mice fed a control diet or DIO regimen. Representative micrographs of immunohistochemical staining of tumors for e-cadherin, slug, keratin 8 and ERα (20×),B, bar graphs presenting Aperio quantification, and C, bar graphs depicting gene expression of EMT markers, means ± SD, (n = 5 per group). Significant differences are indicated by an asterisk; P≤0.05. Positive staining for ERα and slug was further stratified by 1+, low; 2+, moderate; and 3+, intense staining.

