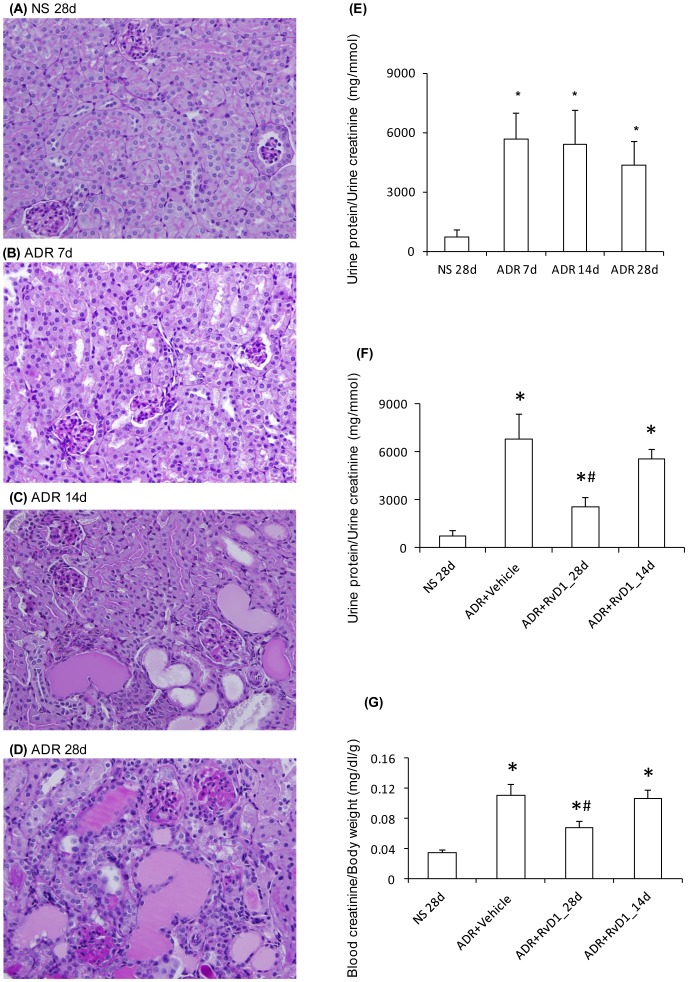
Figure 1. Characterization of ADR-induced nephropathy.
PAS staining of sections from mouse kidneys: (A) 28 days after normal saline (NS) injection, or (B) 7 days, (C), 14 days, and (D) 28 days, after ADR injection. (E) Urine protein to creatinine ratio over the time-course of ADR pathropathy. (F) Urine protein to creatinine ratio on day 28 of ADR nephropathy after early (28d) or late (14d) RvD1 treatment. (G) Renal function assessed by blood creatinine to body weight on day 28 of ADR nephropathy after early (28d) or late (14d) RvD1 treatment. Data are mean ± SD, n = 6. * P<0.05 vs NS 28d; # P<0.05 vs ADR+vehicle and vs ADR+RvD1_14d. Original magnification, x400 (A–D).

