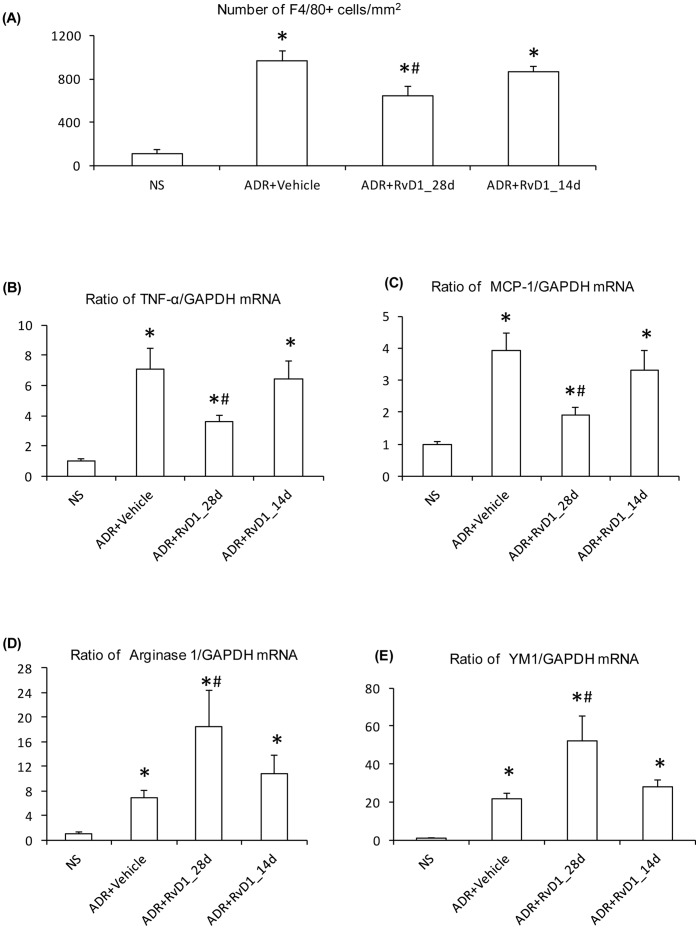
Figure 4. Effects of RvD1 treatment on macrophage infiltration in ADR nephropathy.
(A) Quantification of F4/80+ macrophages/mm2 for normal saline (NS) controls, and day 28 ADR with vehicle treatment or with early (28d) or late (14d) RvD1 treatment. Real-time RT-PCR analysis of kidney mRNA levels of: (B) TNF-α; (C) MCP-1; (D) Arginase 1, and; (E) YM1. Data are mean ± SD, n = 6. *P<0.05 vs NS; #P<0.05 vs ADR+Vehicle or ADR+RvD1_14d.

