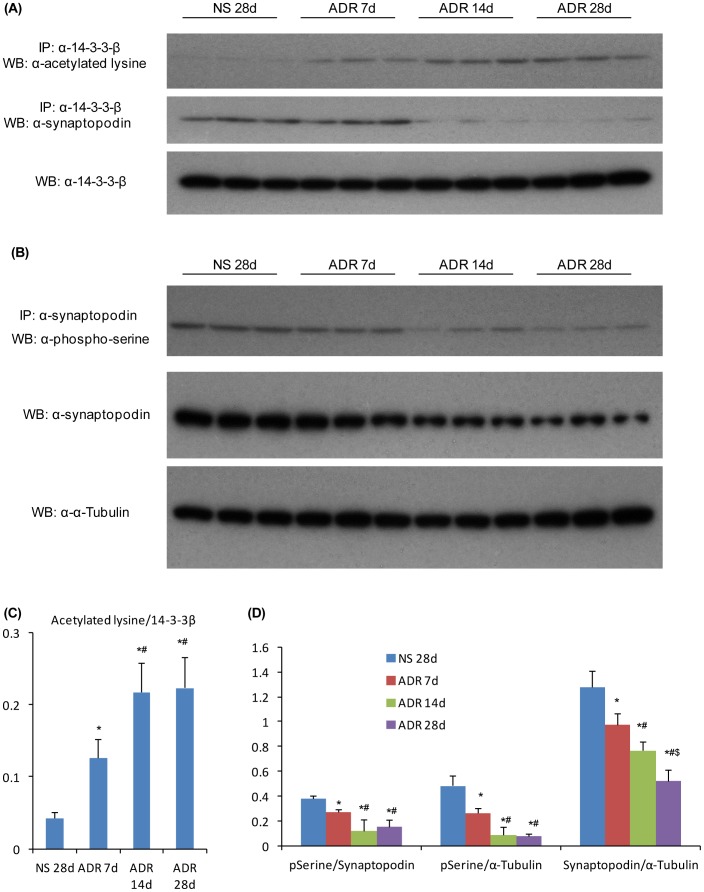
Figure 5. Induction of lysine acetylation in 14-3-3β and reduction of serine phosphorylation in synaptopodin in ADR nephropathy.
Whole kidney lysates from normal saline treated mice or from mice 7, 14 or 28 days after ADR administration were examined by immunoprecipitation (IP)/Western blotting (WB) analysis. (A) IP for 14-3-3β followed by (top blot) WB for acetylated lysine showing a progressive increase in 14-3-3β acetylation in ADR nephropathy, or (middle blot) WB for synaptopodin showing binding between 14-3-3β and synaptopodin, and (bottom blot) WB for 14-3-3β showing equivalent IP of 14-3-3β from all lysates. (B) IP for synaptopodin followed by (top blot) WB for phosphor-serine showing a progressive loss of synaptopodin phosphorylation in ADR nephropathy, or (middle blot) WB for synaptopodin showing a progressive loss of synaptopodin expression in the progression of ADR nephropathy; (bottom blot) lysates were probed for α-tubulin to confirm equivalent protein content. (C) Graph shows densitometric analysis of the ratio of acetylated lysine to total 14-3-3β. Data are mean ± SD, n = 6. *P<0.05 vs NS 28d; #P<0.05 vs ADR 7d. (D) Graphs show densitometric analysis of the ratio of phospho-serine to total synaptopodin, the ratio of phospho-serine to α-tubulin, and the ratio of synaptopodin to α-tubulin (D). Data are mean ± SD, n = 6. *P<0.05 vs NS 28d; #P<0.05 vs ADR 7d; $ P<0.05 vs ADR 14d.

