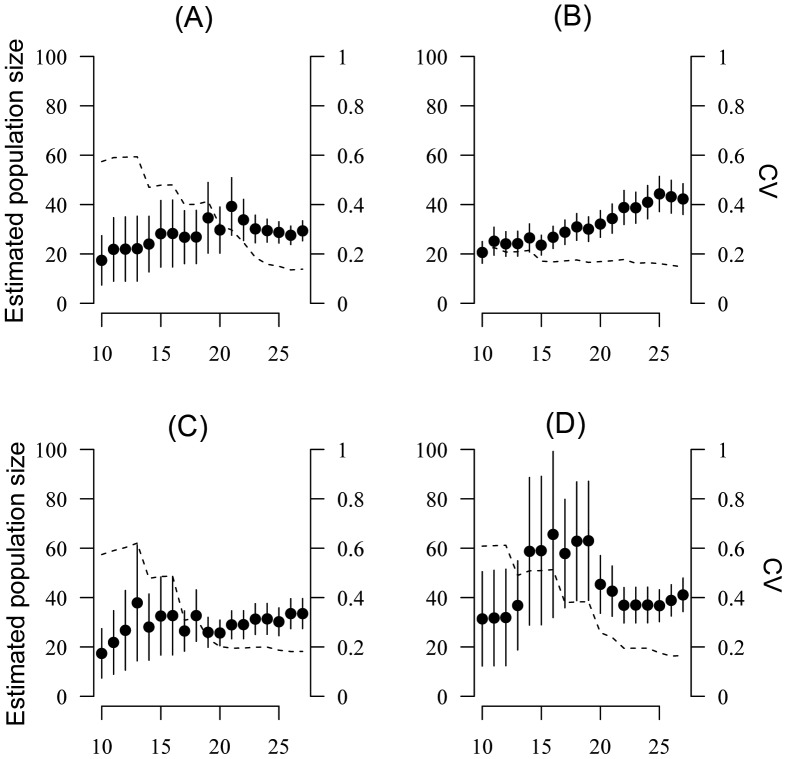
Figure 2. Estimation of Dendrobates tinctorius population size with increasing number of capture occasions.
Evolution of population size (N, right axis) and standard deviation around the mean value estimated for D. tinctorius in habitat H2 by increasing the number of capture occasions for each of the four transect in habitat H2 (A) TH2A, (B) TH2B, (C) TH2C and (D) TH2D. Dotted lines represent variation of the coefficient of variation CV (left axis).

