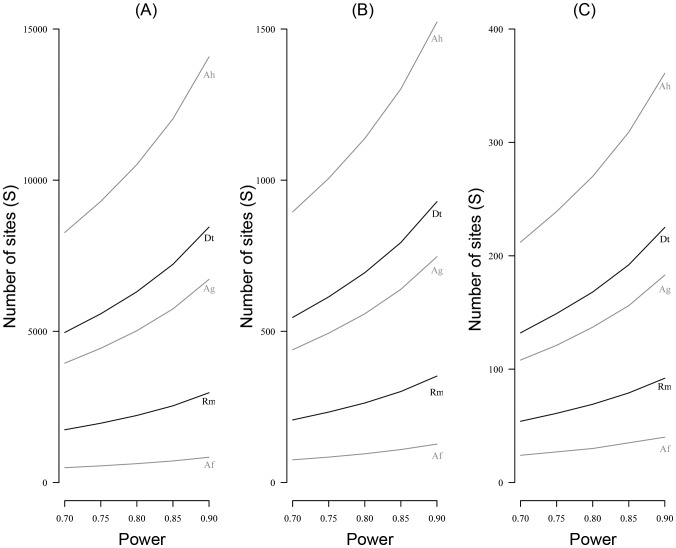
Figure 4. Number of sites to detect an occupancy decline with a given power.
Number of sites (S) required to detect a decline for Af – A. femoralis, Rm – R. margaritifera, Ag – A. granti, Dt – D. tinctorius, Ah – A. hahneli with a given power for (A) R = 0.05, i.e. a decline of 5% between survey one and survey two, (B) R = 0.15 and (C) R = 0.30. Species with audio detection are indicated in grey and species with visual detection in black.

