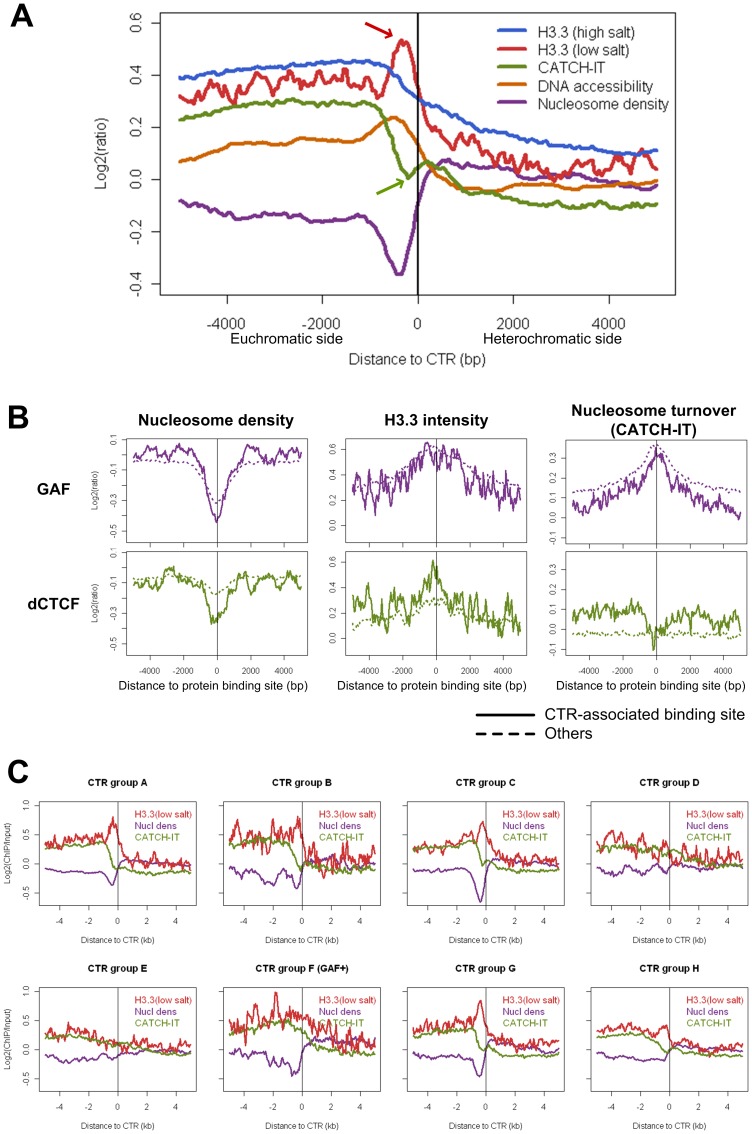
Figure 7. Contrasting patterns of H3.3 enrichment and nucleosome turnover rate associated with subgroups of CTRs in Drosophila S2 cell line.
(A) Composite plot for all CTRs. H3.3 (low salt) incorporation is enriched on the euchromatic side of CTRs (red arrow), while nucleosome turnover rate (CATCH-IT) is drops down sharply at the same region (green arrow). (B) H3.3 enrichment and CATCH-IT measurements of nucleosome turnover rate moves to the same direction for GAF (both CTR-associated and others). In contrast, for CTR-associated dCTCF binding sites, the enrichment of H3.3 is accompanied by decreased turnover rate. (C) Plots of H3.3 enrichment (red), nucleosome turnover rate (green, measured with CATCH-IT), and nucleosome density (purple) for each subgroup of the CTRs (for group F only those co-localized with GAF were included). Note the contrasting pattern between H3.3 enrichment and CATCH-IT profile in subgroups A, B, C, G, but not in subgroups D and E.

