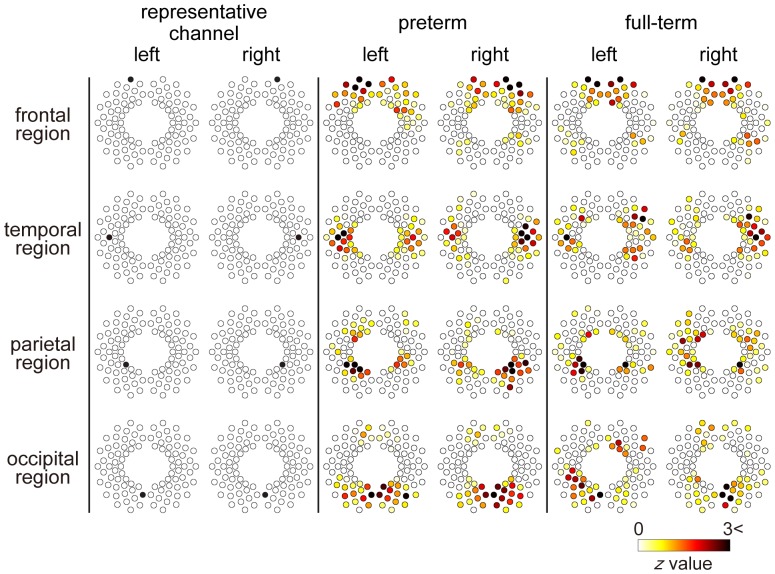
Figure 2. Representative correlation maps corresponding to various measurement channels.
Results are displayed utilizing a z threshold of 0 in order to determine the brain regions that showed significant connectivity to a single channel. These networks were identified by examining representative channels that were located in the frontal, temporal, parietal, and occipital regions. We also evaluated the spatial distribution of RSFC in all other channels (Figure S1 and S2). Preterm: preterm infant group, full-term: full-term neonate group.

