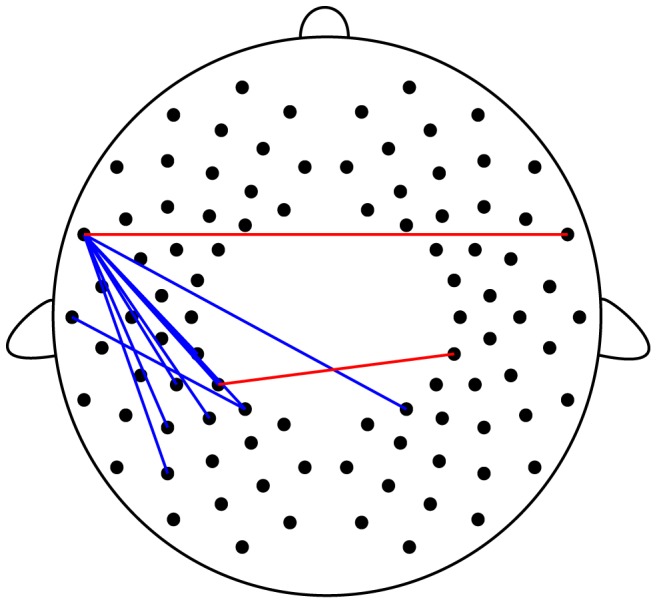
Figure 3. Significant differences in functional connectivity between preterm infants at term-equivalent ages and full-term neonates.

The lines represent z values >3.29 (corresponding to p<0.0005, uncorrected). The red lines show the connections significantly higher in preterm infants. The blue lines show the connections significantly higher in full-term neonates.
