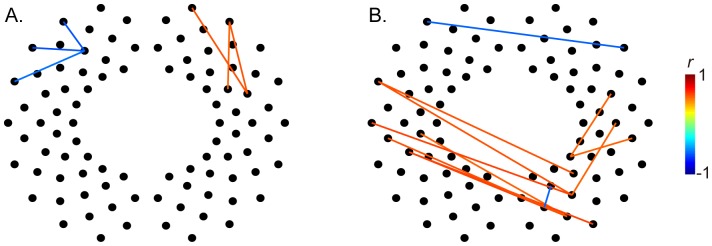
Figure 4. Developmental changes of functional connections.

Each line showed correlation coefficients (r values) between z (r) values in measurement channels for each channel and PMA at the time of the scan in the preterm (A) and full-term groups (B). The displayed results fulfilled the criteria of significance (p<0.005, uncorrected). Detailed results of the relationship between each line are shown in Supplementary Figures S3 and S4.
