
Figure 4. Infected human and vector populations at year 30.
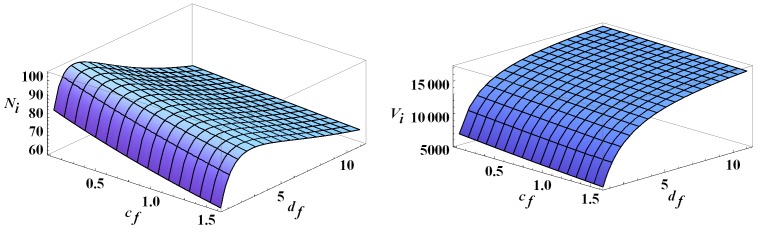
The infected human and infected vector populations at year 30 as functions of  and
and  All other parameters are set to their baseline values.
Official websites use .gov
A
.gov website belongs to an official
government organization in the United States.
Secure .gov websites use HTTPS
A lock (
) or https:// means you've safely
connected to the .gov website. Share sensitive
information only on official, secure websites.
The infected human and infected vector populations at year 30 as functions of and All other parameters are set to their baseline values.