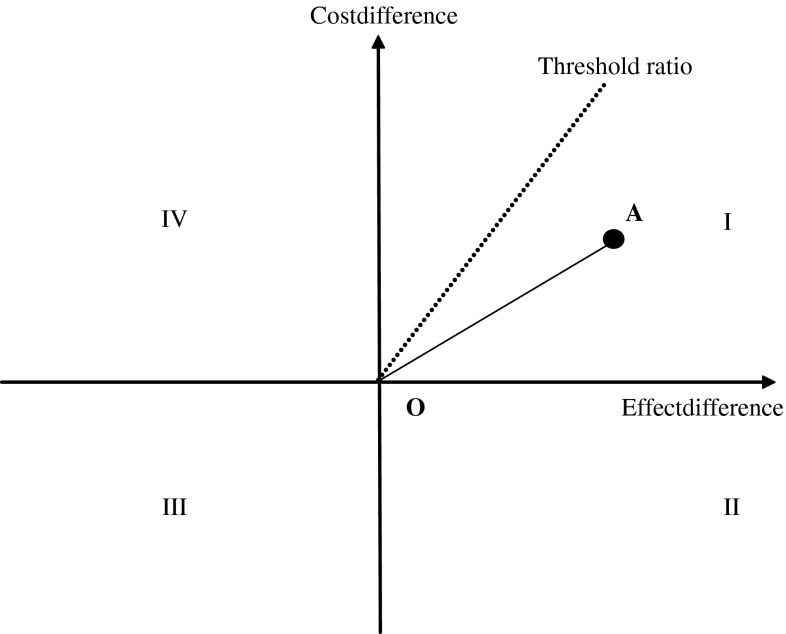
Fig. 1.
Cost-effectiveness plane. The difference in quality-adjusted life-years between intervention A and comparator O is represented on the horizontal axis and the difference in cost, on the vertical axis. The slope of the line between intervention A and comparator O is the incremental cost-effectiveness ratio. If A is located in quadrant II or IV, it is dominant (more effective and less costly than comparator O); in quadrant IV, intervention A is less effective and more costly than O. In quadrant I, A is more effective but more costly; and in III, it is less effective and less costly. The choice will depend on the cost-effectiveness threshold that represents the maximum amount the decision maker is willing to pay for a unit of effectiveness. Interventions that fall below the cost-effective threshold would be deemed cost-effective

