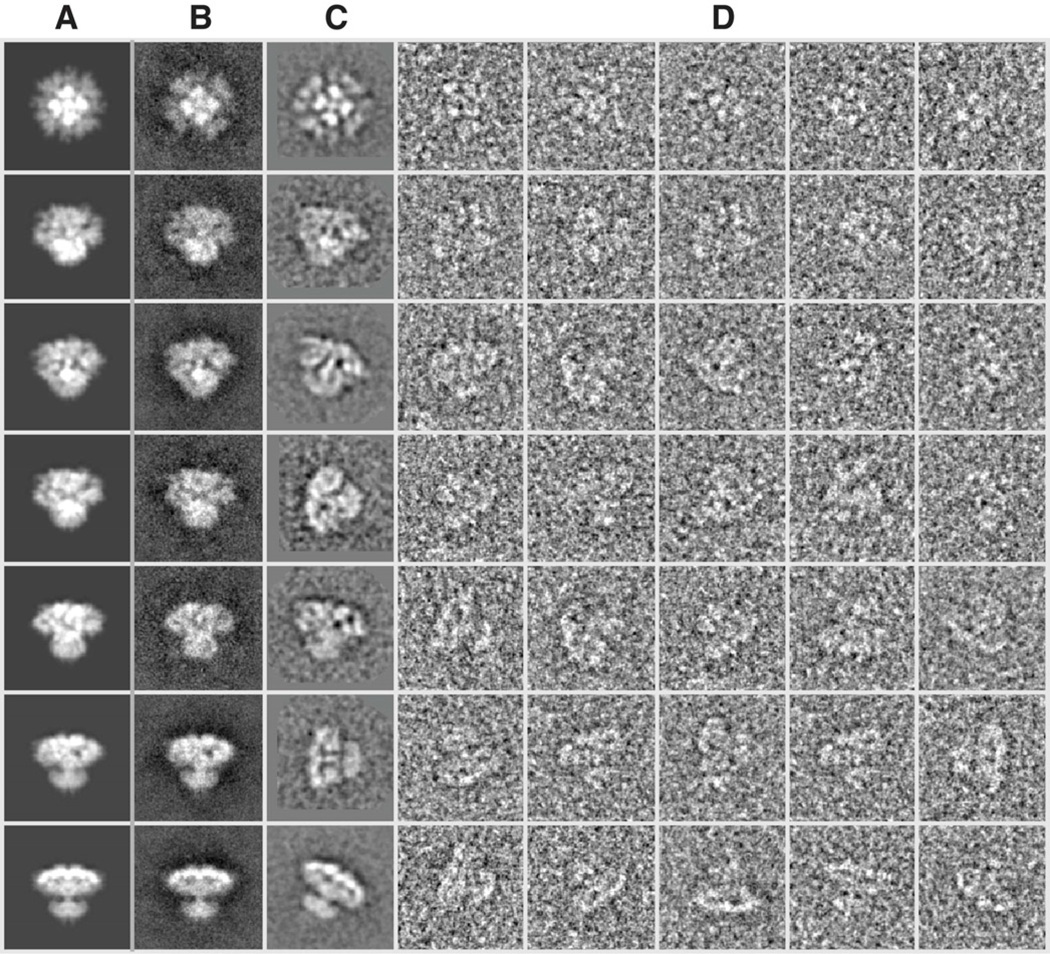
Figure 1. Class-average self-consistency test.
Projections of the 3D map (A), reference-based class-averages (B), reference-free class-averages (unaligned, C), and selected (unaligned) individual particle images (D) are shown for comparison. Only a representative subset of the full set of projection orientations is shown, but clear qualitative agreement between the four types of images can be observed in each row.

