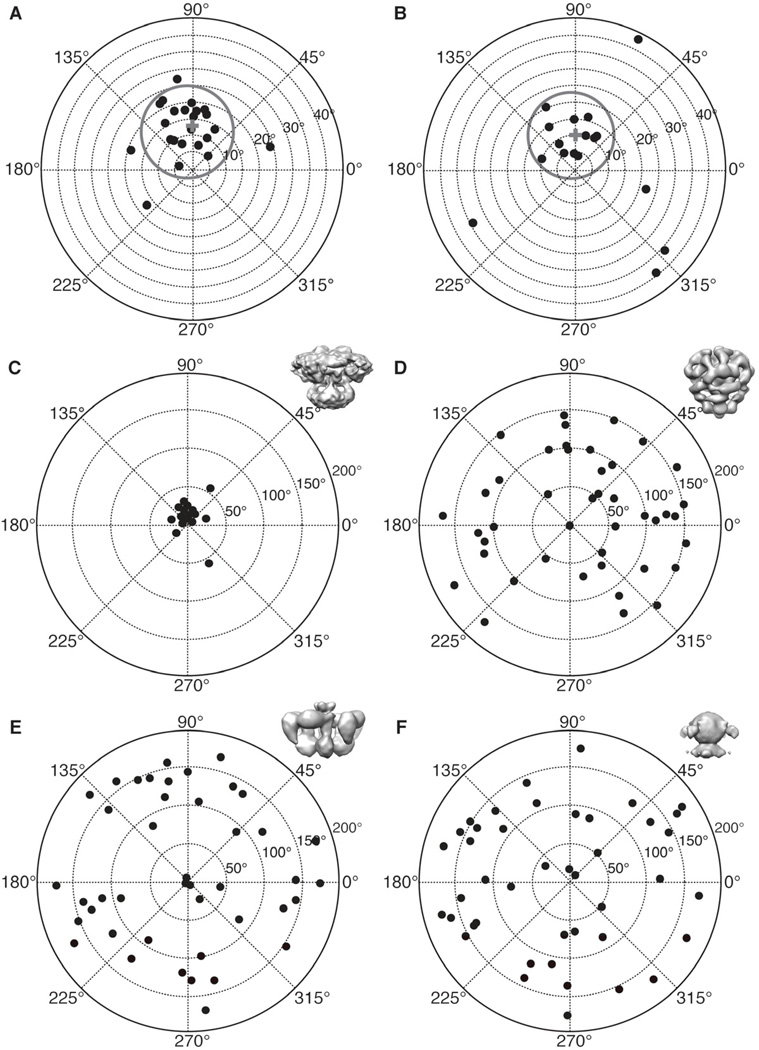
Figure 2. Results of tilt-pair analysis.
(A, B) IP3R1 tilt-pair validation plots for two image tilt-pairs. The grey circles denote particle pairs that cluster around the experimental tilt geometry, thus validating our IP3R1 map (EMDB-5278)(Ludtke et al., 2011). A cross indicates the center of the cluster and each point represents a single pair of particles. The radial value indicates the amount of tilt determined between the pair of particles, and azimuthal value indicates the direction of tilt. Ideally all points would fall at exactly the experimental tilt/direction. Some spread indicates the relative uncertainty in orientation determination. Note that the radial axis extends only to 40 degrees in these plots. Corresponding statistics for used tilt-pair images is given in Table S1. (C) The same plot as in (A) is shown at larger scale. Validation plots for the same tilt-pair images as in (A) were calculated against different 3D maps, (D) EMDB-1061 (Sato et al., 2004), (E) from (Serysheva et al., 2003), and (F) from (Jiang et al., 2002). Note that the three previously published maps produce a completely random distribution with no clustering. See also Table S1 and Figure S2.

