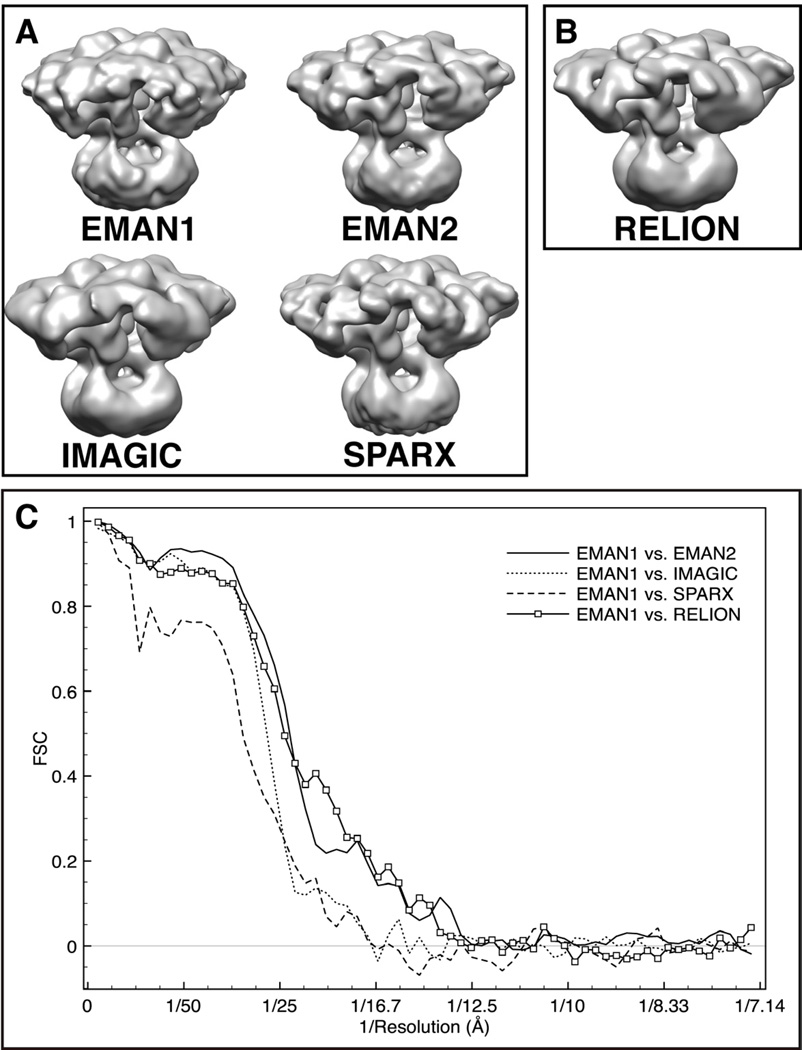
Figure 3. 3D reconstructions of IP3R1 generated with different software packages.
Maps were calculated using the same set of cryo-EM images and a matching filter was applied to bring each to the same ~20 Å resolution, with a comparable contour level. (A) 3D reconstructions performed reference-free; (B) 3D structure reconstructed using an initial model generated from an EMAN2 structure that had been low pass filtered by RELION; (C) FSCs between the reconstructions from EMAN1 and the maps generated using other software packages. See also Figure S1 and Figure S2.

