
Figure 2.
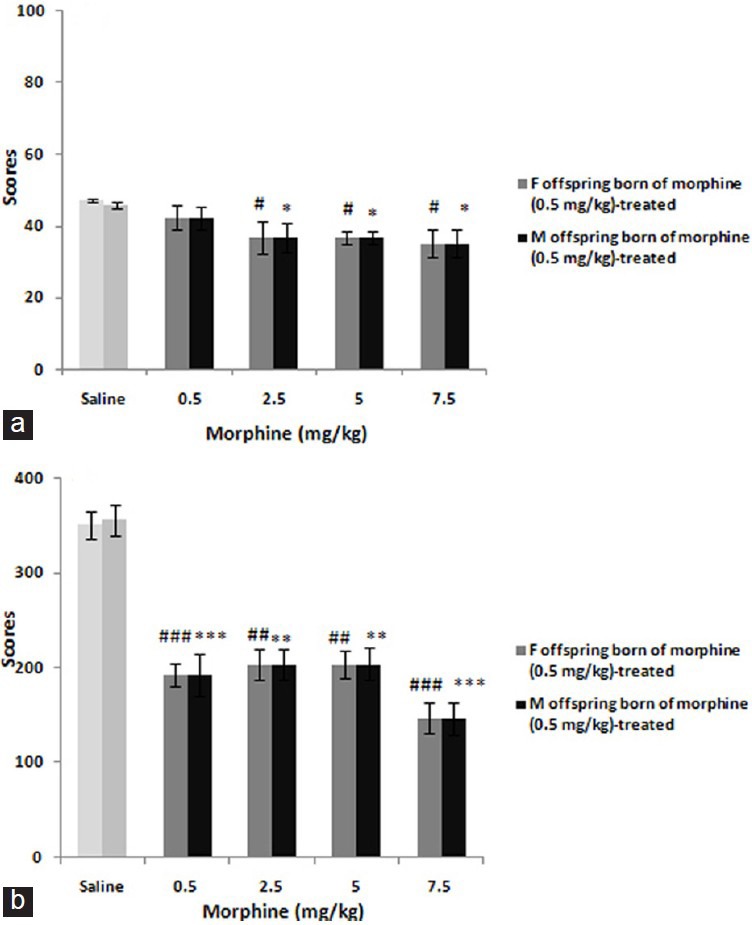
The figure shows the dose-response curves for morphine (0.5-7.5 mg/kg) in offspring born of morphine 0.5 mg/kg-treated mothers. The scores were calculated according to the protocol described in material and method section and shown as mean ± SEM. Based on post hoc analyses *P<0.05, **P<0.01, ***P<0.001, #P<0.05, ##P<0.01, ###P<0.001 are differences to controls