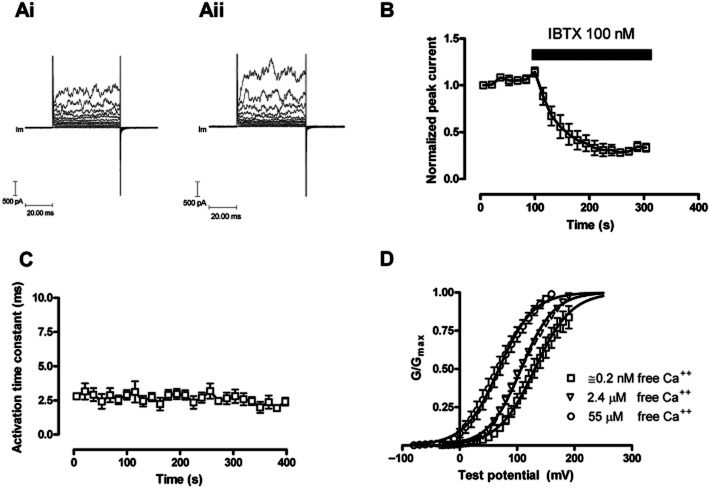
Figure 4.
The change in evoked BKCa currents with time in HEK 293 cells expressing the α subunit (hSloα) of the BKCa channel. HEK 293 cells were voltage clamped at −40 mV and currents evoked by changing the voltage to a range of test potentials (−40 mV to 60 mV). (Ai) illustrates evoked currents in a HEK 293 cell at the beginning of the recording period; (Aii) illustrates evoked currents after 350 s of recording. (B) The blocking properties of IBTX on BKCa channels formed from α subunits alone. Currents were evoked at +60 mV from a holding potential of −40 mV (n = 5). (C) The activation time constant for currents evoked by changing the potential to +60 mV; the activation of the BKCa current could be fitted to a single exponential (n = 5). The free intracellular calcium ion concentration in panels Ai, Aii, B and C was 0.2 nM. (D) The effects of free intracellular Ca++ on the hSloα G–V relationship. Conductance was calculated from current and voltage, normalized to the maximum, and plotted error bars represent SEM. Solid curves represent fits to the Boltzmann function. V(1/2) for 0.2 nM, 2.4 μM and 55 μM free calcium were 130.9 ± 1.8 mV, 107 ± 0.7 mV and 68.3 ± 1.6 mV, respectively.

