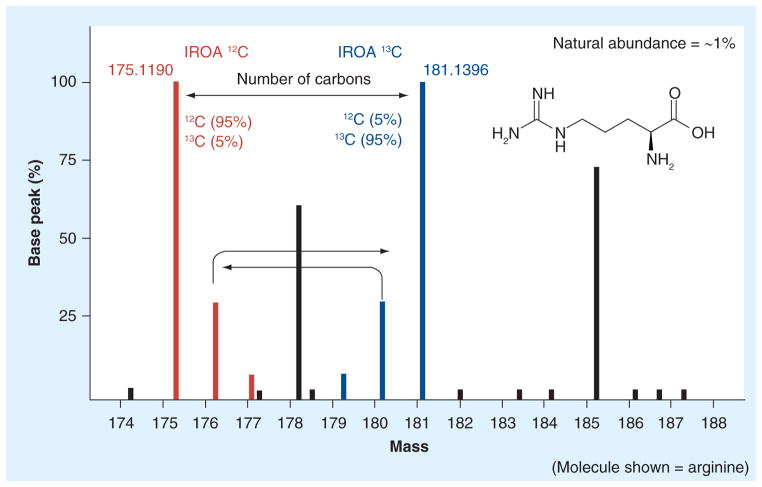
Figure 2. The Isotopic Ratio Outlier Analysis™ peaks.
In the case of arginine, the 12C M+ located at 175.1190 and its 13C mate at 181.1396 clearly indicate a six-carbon molecule. The corresponding M+1 and M-1 peaks are a mass difference of 1.00335 amu (the mass difference between a 13C and 12C isotope). Natural abundance peaks (in black) from exogenous sources do not have a 13C counterpart and are not considered in the analysis. IROA 12C peaks (red) and IROA 13C peaks (blue) are from biologically derived compounds.
IROA: Isotopic Ratio Outlier Analysis™.

