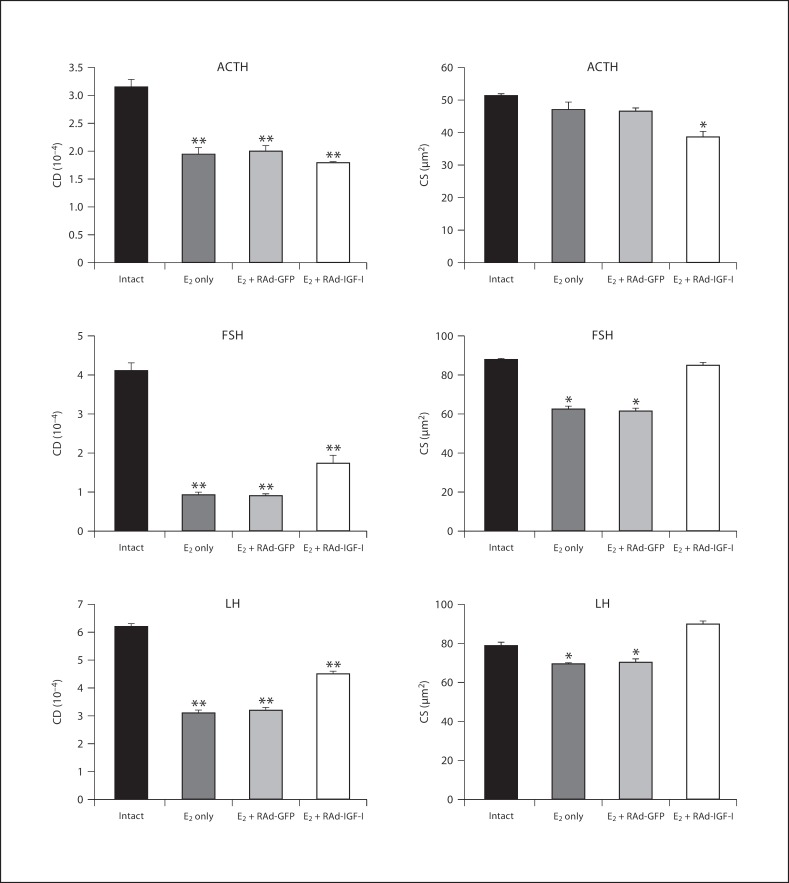
Fig. 4.
Effect of IGF-I gene therapy on cell density (CD) and cell size (CS) of corticotropes (ACTH cells) and gonadotropes (FSH and LH cells) in the pituitaries of an intact animal and animals treated with estrogen only (E2 only) or estrogen plus RAd-GFP (E2 + RAd-GFP) (control treatments) or IGF-I gene therapy (E2 + RAd-IGF-I). Columns represent mean values and bars above columns represent SEM values. Five pituitaries per group were assessed. * p < 0.05, ** p < 0.01 compared to the intact group.

