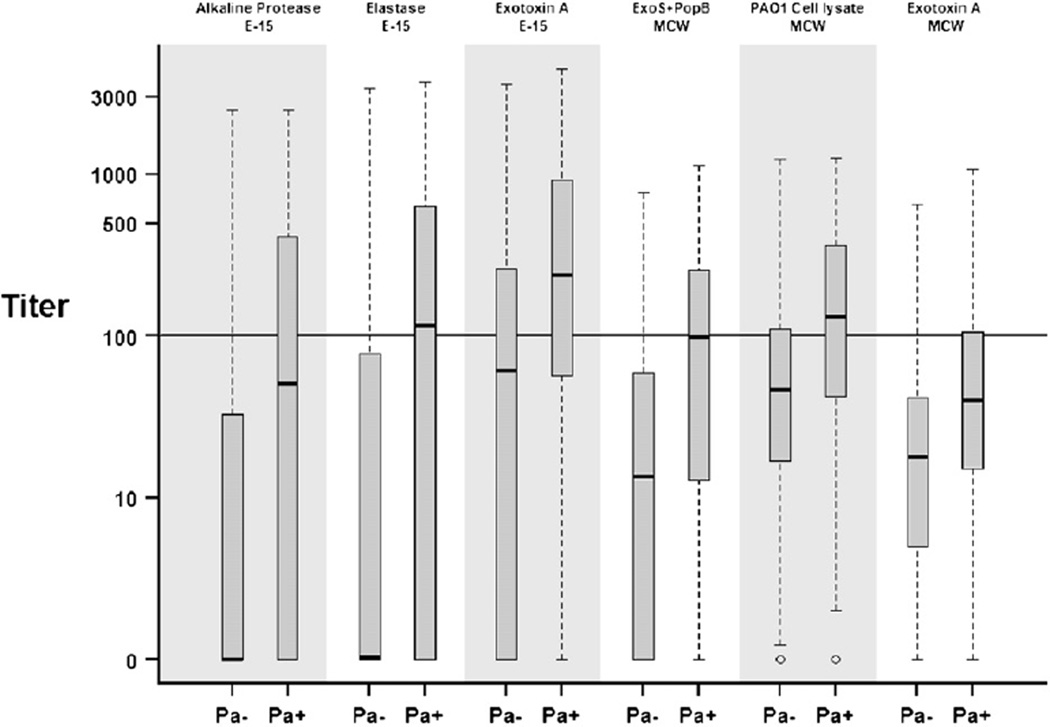
Fig. 1.
Distribution of individual antigen titers by concurrent culture status for all 975 serum samples. Pa+ indicates P. aeruginosa positive, Pa− indicates P. aeruginosa negative. Hash lines are the median values, boxes represent the 25th and 75th percentiles (inter-quartile range), whiskers extend to minimum and maximum or 1.5× the inter-quartile range (whichever is smaller), outliers are marked as circles.

