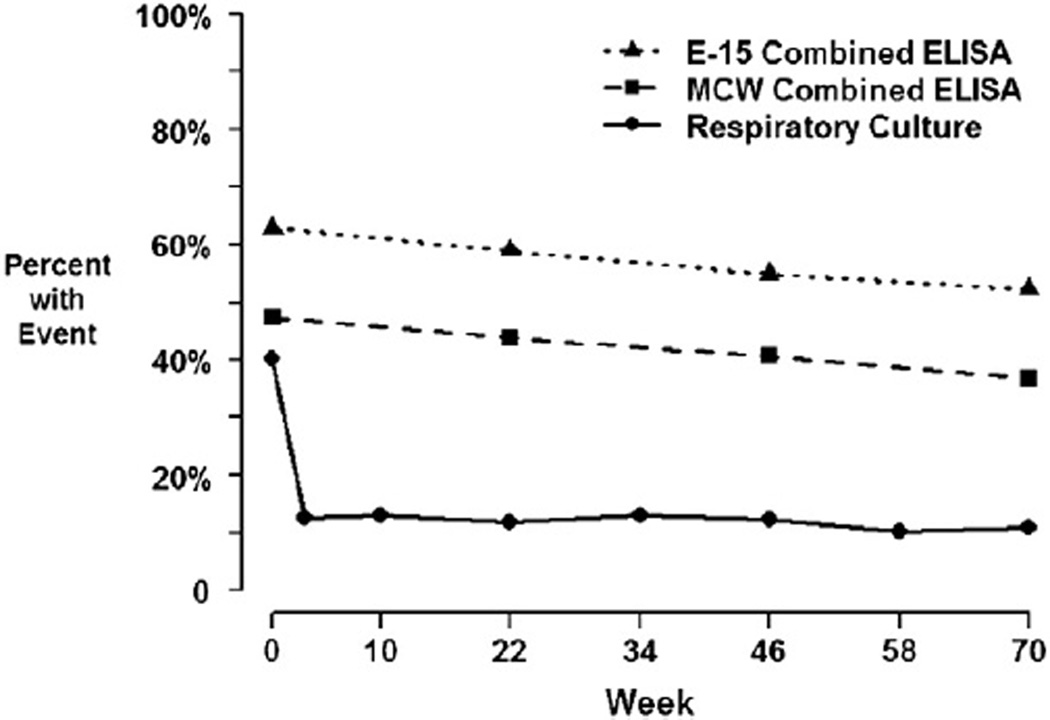
Fig. 2.
Culture positivity and seropositivity over time. The solid black line shows the proportion culture positive for P. aeruginosa across each visit among the 303 subjects with available serology. The dashed lines show the proportion of samples seropositive at each visit for each combined ELISA. A combined ELISA is defined as seropositive if any one of the three antigens in an ELISA has titer at least 100.

