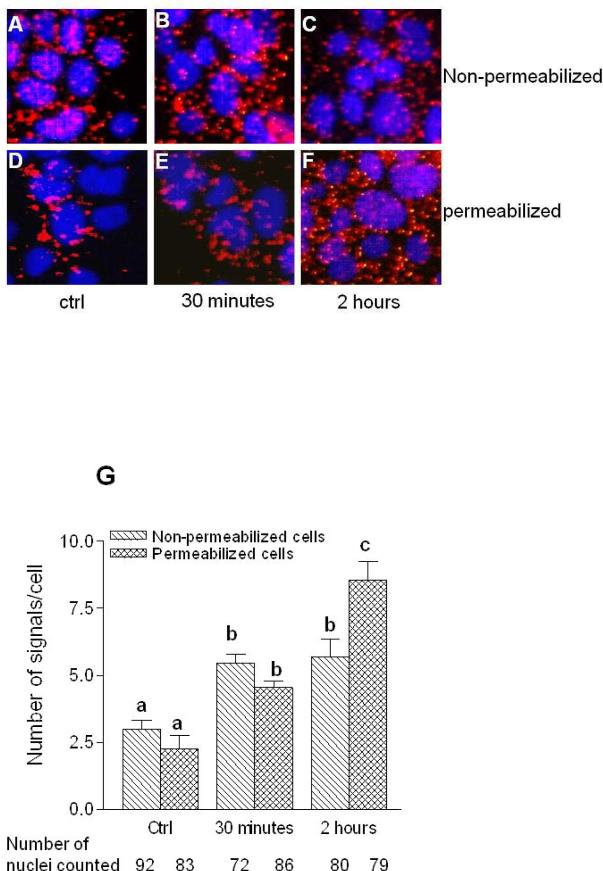
Fig. 4. The proximity between DAF and Caveolin1 increases after NO exposure.
Ishikawa cells were sparsely grown on 16-well Lab-Tek chamber slide for 48 h and then treated with 1 mM DETANONOate for different time periods. Representative images of Proximity ligation assay for DAF and Caveolin1 performed before (upper panel, A-C) and after (lower panel, D-F) permeabilizing the paraformaldehyde fixed cells. Cells were either not exposed (A and D) or exposed to DETANONOate for 30 minutes (B and E) or exposed to DETANONOate for 2 h (C and F). (G) Number of signals per cell in control and NO exposed cells are plotted. Number of signals per cell in non-permeabilized cells increased significantly within 30 minutes (p<0.05 versus control) and remained same after 2 h exposure to NO (p<0.01versus control). Number of signals per cell in permeabilized cells increased significantly within 30 minutes (p<0.05 versus control) and then further increased after 2 h exposure to NO (p<0.01 versus 30 minutes exposure and p<0.001 versus control). Data shown are the means ± S.E.M. of six independent experiments. Different letters above each column in bar graph indicate significant differences. Statistical analysis was done by one-way ANOVA with Bonferroni's multiple comparison test.

