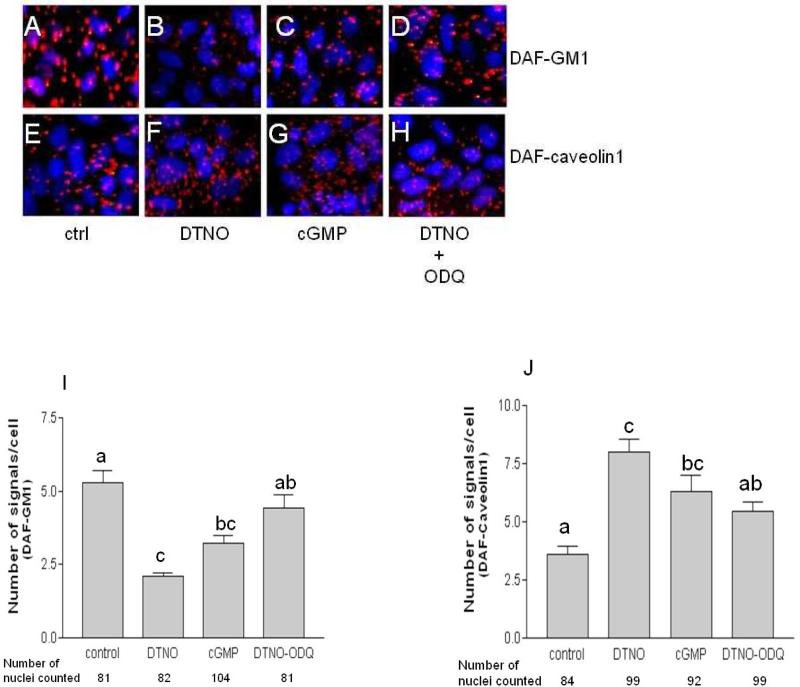
Fig. 6. The NO induced changes in proximity between DAF-GM1 and DAF-caveolin1 is mediated through cGMP.
Ishikawa cells were sparsely grown on 16-well Lab-Tek chamber slide for 48 h and then treated with 1 mM DETANONOate, 0.1 mM 8brcGMP and 0.3 μM ODQ for 2 h. Representative images of Proximity ligation assay for DAF and GM1 (A-D), DAF and Caveolin1 (E-H). Cells were either not exposed (A and E) or exposed to DETANONOate (B and F) or exposed to 8brcGMP (C and G) or exposed to ODQ (D and H). (I) Number of signals per cell for DAF and GM1 proximity in control and treated cells are plotted. Signals per cell decreased by DETANONOate and cGMP treatment (p<0.001 and p<0.01 respectively compared to control) and reversed by ODQ treatment (p<0.001 compared to DETANONOate treated cells). (J) Number of signals per cell for DAF and caveolin1 proximity in control and treated cells are plotted. Signals per cell increased by DETANONOate and cGMP treatment (p<0.001 and p<0.05 respectively compared to control) and reversed by ODQ treatment (p<0.05 compared to DETANONOate treated cells). Data shown are the means ± S.E.M. of six independent experiments. Different letters on each column in bar graphs indicate significant difference. Statistical analysis was done by one-way ANOVA with Bonferroni's multiple comparison test.

