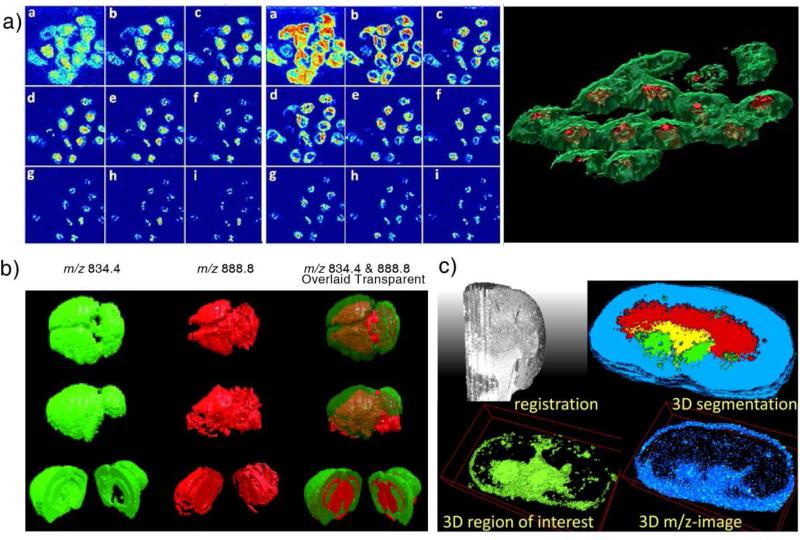
Figure 2.
(a) SIMS depth profiling of the distribution of adenine (m/z 136.1, left panel) and phosphocholine head group (m/z 184.1, middle panel) in nine layers at different depth. Right panel: 3D visualization of the membrane (green, phosphocholine head group) and nucleus (red, adenine) [13]. (b) 3D images of mouse brain obtained with DESI. 3D reconstructions from different view angles show the distributions of PS 18:0/22:6 (m/z 834.4) in green, ST 24:1 (m/z 888.8) in red, and the overlaid distribution [12]. (c) 3D imaging of mouse kidney with MALDI [17].

