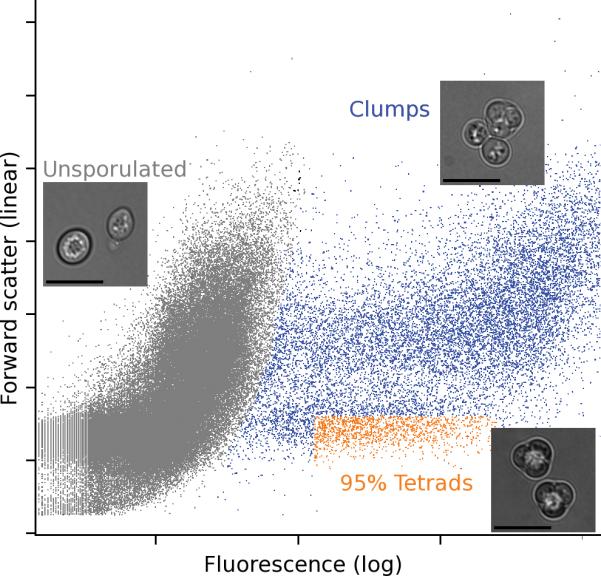
Figure 2. Isolation of tetrads.

The sporulation-specific fluorescent reporter on the plasmid allows the use of FACS to quickly identify and collect tetrads from the sporulation culture. The gating parameters (orange region) separate tetrads from vegetative, dead, and clumped cells as well as 2-spore dyads (gray and blue regions). Inset images show representative examples of cells present in each region of the FACS plot. Images were acquired with an Applied Precision DeltaVision microscope with a 60x oil-immersion objective and Photometrics CoolSnap HQ2 camera. The scale bar is 5 μm.
