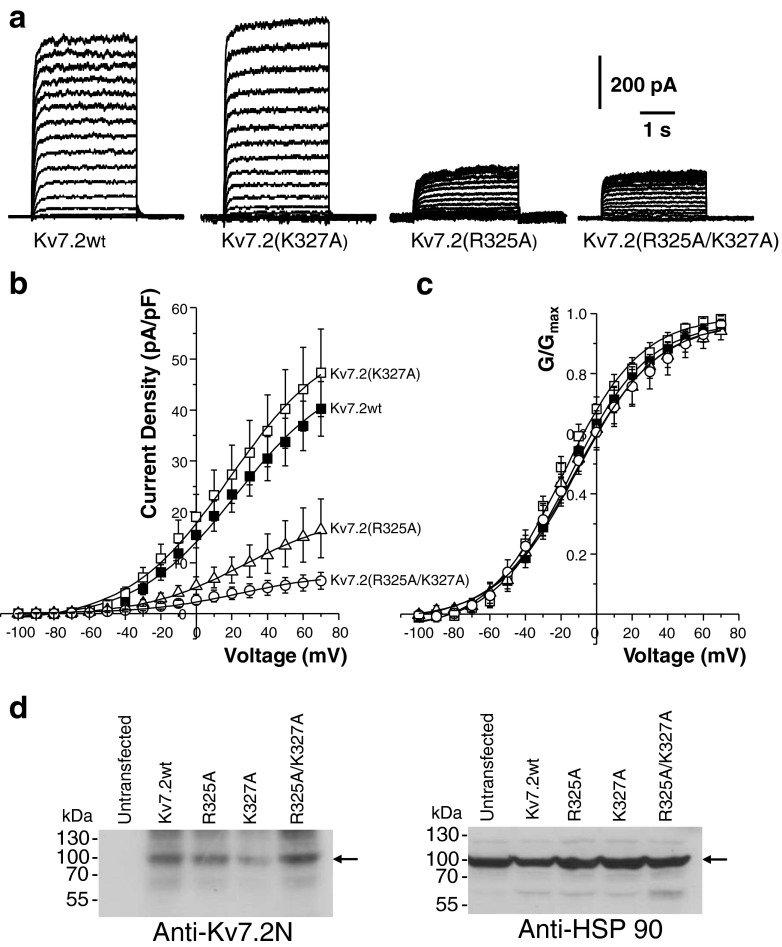
Fig. 2.
Currents in HM1-CHO cells transfected with cDNA plasmids encoding wild-type (wt) and mutated Kv7.2 channels. Cell-attached perforated-patch recording. a Currents generated by 3 s voltage steps from −100 to +70 mV in incremental steps of 10 mV from a holding potential of −70 mV. b Mean current densities (in picoampere per picofarad) plotted against command potential (in millivolt). Bars show SEMs (n = 7–11 for each mutant). c Plots of fractional conductance (G/G max) against command voltage. Curves are least-squares Boltzmann plots of mean current b and conductance c against command voltage (see ‘Methods’ section, Eq. (1)). Mean values for the parameters used are given in Table 1. d Western blots showing the total expression of wild-type or mutant proteins within transfected HM1-CHO cells. Kv7.2 was detected as a 100-kDa band (left hand panel) and the total amount of protein loaded was confirmed to be similar by detection of the molecular chaperone, HSP-90 (right hand panel). The marker shown is the Page Ruler Prestained protein ladder (Fermentas, UK)

