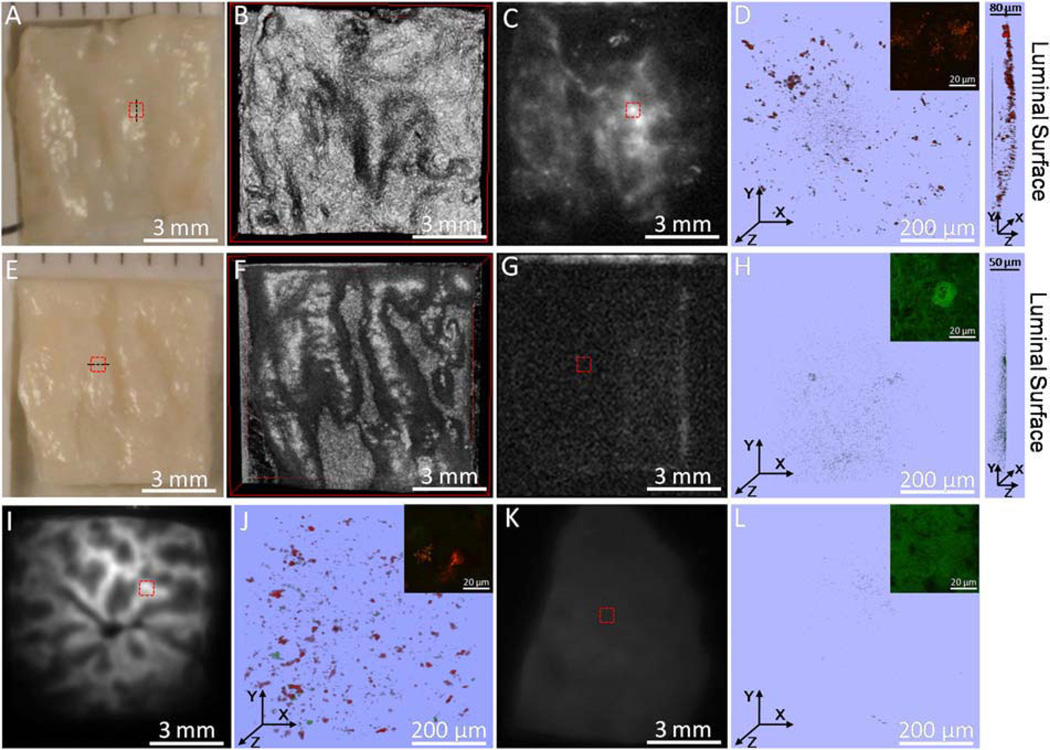
Fig. 5.
A–D: Digital image, 3D OCT, PTW imaging and 3D two-channel TPL microscopy (red box in (A,C)) of an abdominal aorta segment from the Positive rabbit. E–H: Digital image, 3D OCT, PTW imaging and 3D two-channel TPL microscopy (red box in (E,G)) of an abdominal aorta segment from the Control rabbit. I,J: PTW imaging and 3D two-channel TPL microscopy (red box in (I)) of a liver segment from the Positive rabbit. K,L: PTW imaging and 3D two-channel TPL microscopy (red box in (K)) of a liver segment from the Control rabbit. Inset in (D,H,J,L) shows a two-channel TPL image at a single depth at an amplified view within the corresponding 3D TPL image. Right side of (D,H) shows a side view of the corresponding 3D TPL image. Laser power delivered to the sample is 20 mW in all TPL measurements except insets of (H) 59 mW and (L) 45 mW.

