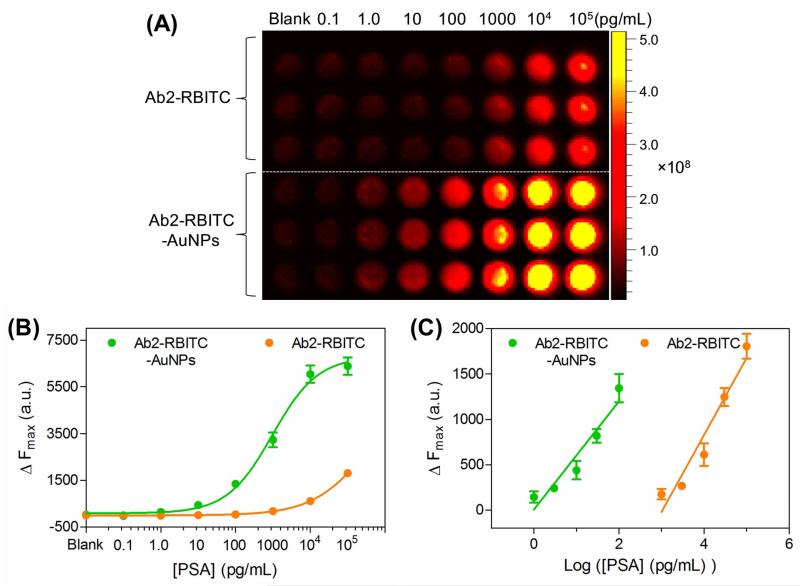
Figure 3.
Conventional fluorescent immunoassay and the activatable immunoassay for sensing various concentrations of PSA in 96-well PS plate. (A) Top panel: fluorescence images of the commonly used fluorescent probe for various concentrations (0.1 pg/mL – 100 ng/mL) of PSA using Ab2-RBITC as detection tags. Bottom panel: fluorescence images of the newly-developed fluorescence activatable probe for the same concentrations of PSA. (B) Comparison of the detection performance of the two probes by plotting fluorescence intensity at 590 nm versus various concentrations of PSA in PBST solutions. (C) The linear range of (B). The PBST-only sample was set as the blank. ΔFmax = F − F0 was used to measure the variations of the fluorescence intensity, where F is the emission fluorescence intensity at 590 nm, and F0 is the background fluorescence. Error bars show standard deviations (n=3).

