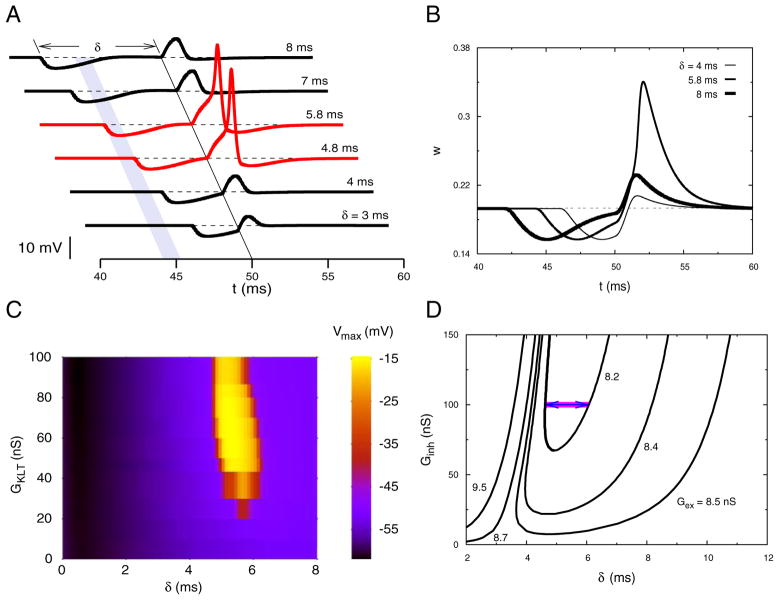
FIG. 1.
Theoretical demonstration of postinhibitory facilitation (PIF). A: time course of the membrane potential in response to a subthreshold excitatory conductance input when a brief synaptic inhibition occurs at various preceding times (δ). Excitation occurs at t = 50 ms in each trace. A spike is evoked when inhibition falls in the shaded time window. Gex = 8.2 nS, τex = 0.3 ms, Ginh = 100 nS, τinh = 0.8 ms. B: time courses of the activation variable w of low-threshold potassium current IKLT plotted for 3 of the curves shown in A. Transient drop in w is caused by priming inhibition and it underlies hyperexcitability and PIF. C: dependency of the PIF time window on GKLT. Maximum depolarization (see A) is plotted for a range of δ values as GKLT is varied. Iapp, Gex, and Ginh are adjusted such that at each GKLT the unstimulated membrane has Vrest = −60 mV, the excitatory postsynaptic potential (EPSP) (when isolated) has a maximum depolarization of −52.31 mV, and the inhibitory postsynaptic potential (IPSP) has a maximum hyperpolarization of −64.85 mV. As GKLT is reduced, the spike region disappears. D: time window for PIF: for peak inhibitory conductance (Ginh) values above a minimum (and for different fixed values of Gex) the range of δ-values that lead to PIF is shown. Parameter values in the region above each U-shaped curve lead to a spike, i.e., the PIF regime. For the 2 monotonic curves (Gex = 8.7 and 9.5 nS) the excitatory input is suprathreshold and any δ to the right of the curve leads to a spike. Arrows indicate the shaded time window shown in A.

