FIG. 3.
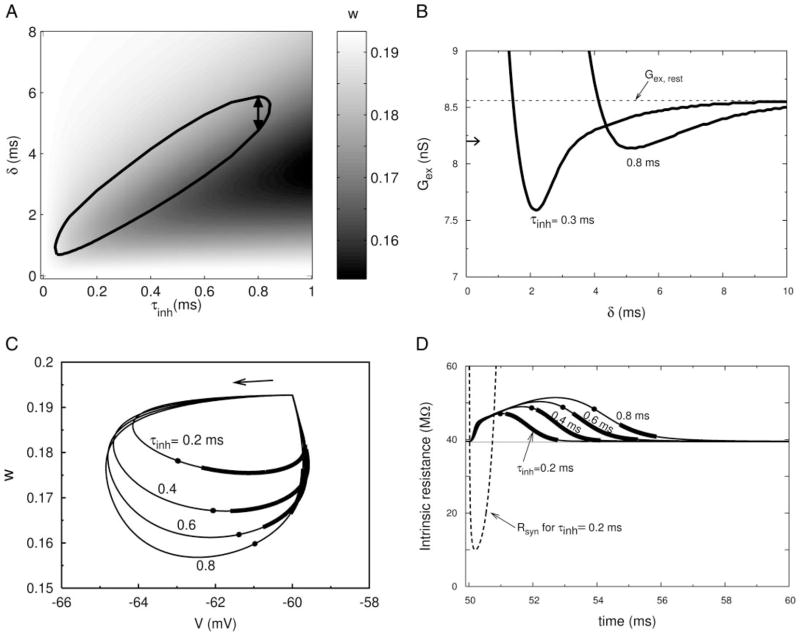
Characterizing the PIF window. A: PIF window (seen in Fig. 1A) plotted vs. τinh, the time constant of the inhibitory conductance for fixed Ginh = 100 nS. Value of w for any given τinh as a function of δ is shown by the intensity of the gray scale. Gex = 8.2 nS, τex = 0.3 ms. Other parameter values are as in Fig. 1. Time window shown in Fig. 1A is indicated here by arrows. B: synaptic threshold (minimum Gex required to evoke a spike) in the PIF window shown in A for 2 values of τinh. Horizontal arrow next to the vertical axis shows the level of Gex used in A. Value Gex,rest corresponds to the threshold value of Gex for generating a spike from the rest state. C: response of the 5-variable model to brief inhibition alone, projected onto the V–w phase plane (for the same parameters as in A) for 4 values of τinh. Susceptible segments for evoking a spike for subthreshold excitation (when given as in A) are marked as thick lines. Filled circles indicate the point at which the inhibitory conductance has fallen to 10% of its peak value. D: total intrinsic (nonsynaptic) resistance of the membrane vs. time for trajectories shown in C. Dashed curve is the resistance arising from the synaptic inhibition alone. Filled circles indicate the same temporal positions as in C.

