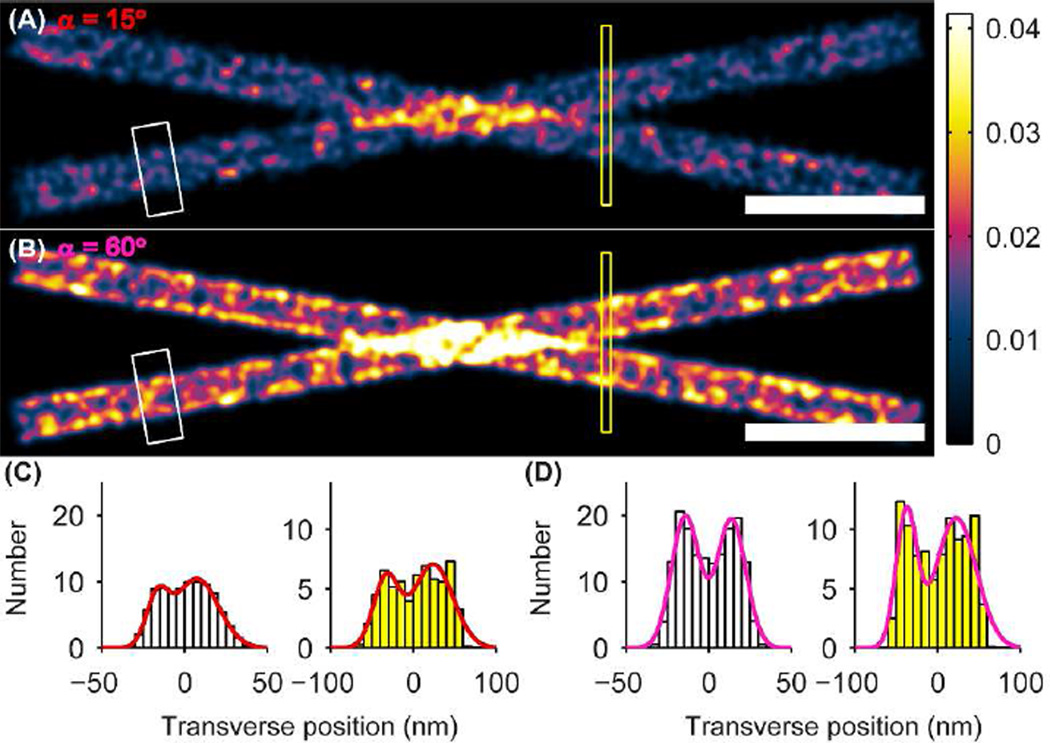
Figure 3.
SMACM imaging simulation of crossing microtubules separated in z by 200 nm whose SM labels form a hollow cylindrical shell of diameter 40 nm. Molecular dipole orientations of the labels are drawn from a uniform distribution. (A) Microtuble image for SM labels confined to a cone of half angle α = 15°. (B) Same as (A) for SM labels confined to a cone of half angle α = 60°. The white and yellow boxes denote the regions histogrammed in (C)–(D). The color scale is in units of number of SMs/(0.5 nm)2. Scale bars: 200 nm. (C) Transverse histograms of one hollow cylindrical microtubule (white, at left) and of the two microtubules near their crossing point (yellow, at right) for α = 15°. Double-Gaussian fits of these histograms are overlaid in red. (D) Same as (C) for α = 60°. Double-Gaussian fits of these histograms are overlaid in magenta.

