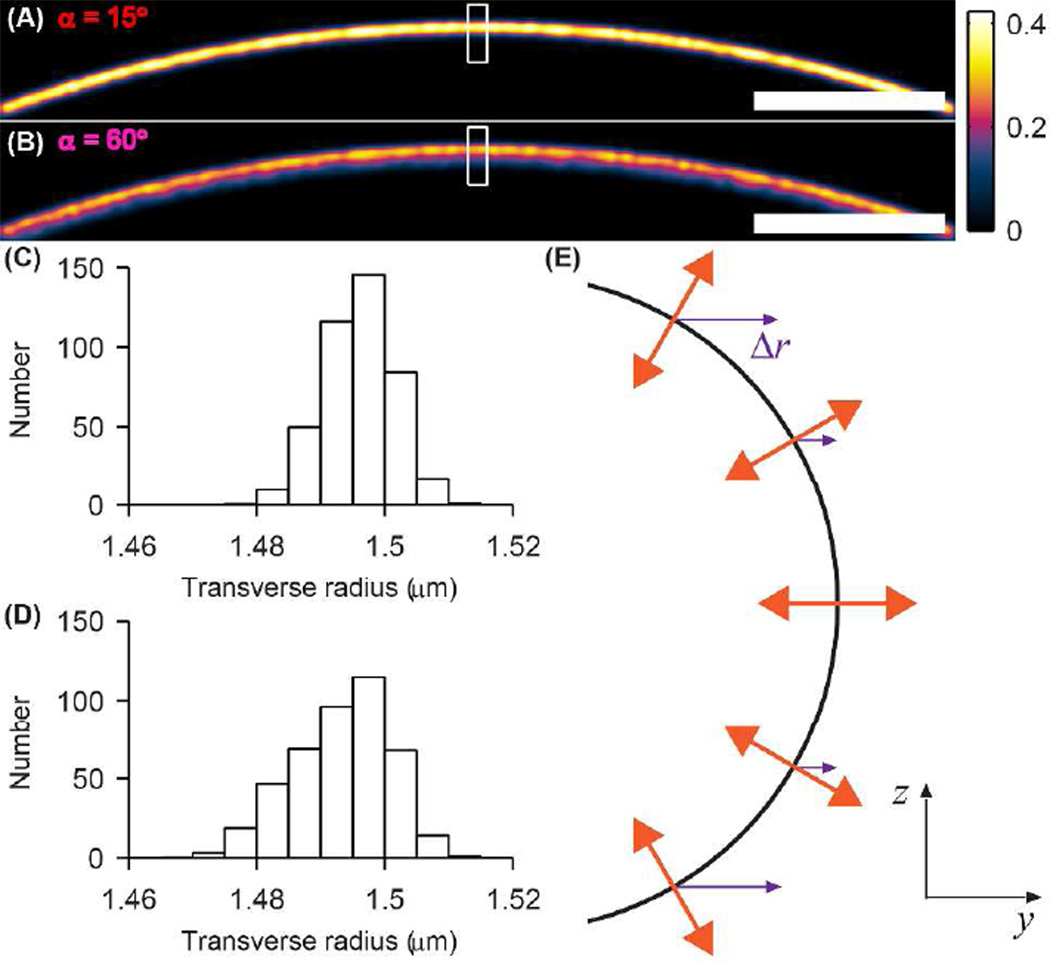
Figure 4.
SMACM imaging simulation of a cell membrane whose labels form a hollow hemispherical shell of radius 1.5 µm and are orientated normal to the membrane surface. (A) Membrane image for SM labels confined to a cone of half angle α = 15°. (B) Same as (A) for SM labels confined to a cone of half angle α = 60°. The white box denotes the region histogrammed in (C)–(D). The color scale is in units of number of SMs/(0.5 nm)2. Scale bars: 200 nm. (C) Transverse histogram of SMs labeling the membrane for α = 15°. (D) Same as (C) for α = 60°. (E) yz schematic depicting the simulated orientation (orange) and relative lateral shift Δr (purple) of SMs labeling the hemispherical cell membrane (black) with the prescribed orientation distribution.

