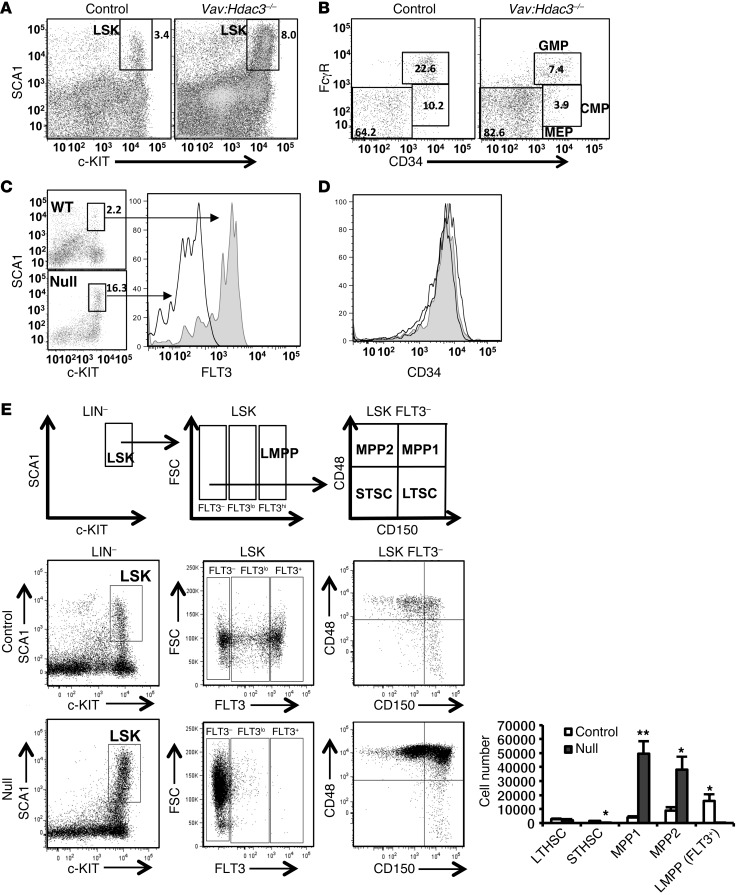
Figure 2. Inactivation of Hdac3 increases early stem and progenitor cells and blocks progression to the FLT3+ stage.
FACS analysis of LIN– bone marrow to examine the (A) LSK population using SCA1 and c-KIT antibodies. (B) FACS analysis of LIN– and c-KIT+ cells in A using FcγR and CD34 antibodies to distinguish GMP, CMP, and MEP populations. (C) Further analysis of LSK population (small plots on the left) using FLT3 antibody and (D) CD34 antibody. Representative FACS plots from at least 5 mice are shown. In D, the shaded curves designate the control mice and the open curves are the null mice. (E) Immunophenotypic analysis of stem and MPP cells. Top panels show the scheme for the flow cytometric analysis and the markers used. Graph at right shows the actual number of cells per leg (STHSC, P= 0.0375; MPP1, P= 0.0069; MPP2, P= 0.04; LMPP, P= 0.0295). Numbers in each box indicate the relative percentage of the cells in the indicated gated population. *P < 0.05; **P < 0.007. LTHSC, long-term HSC; STHSC, short-term HSC.

