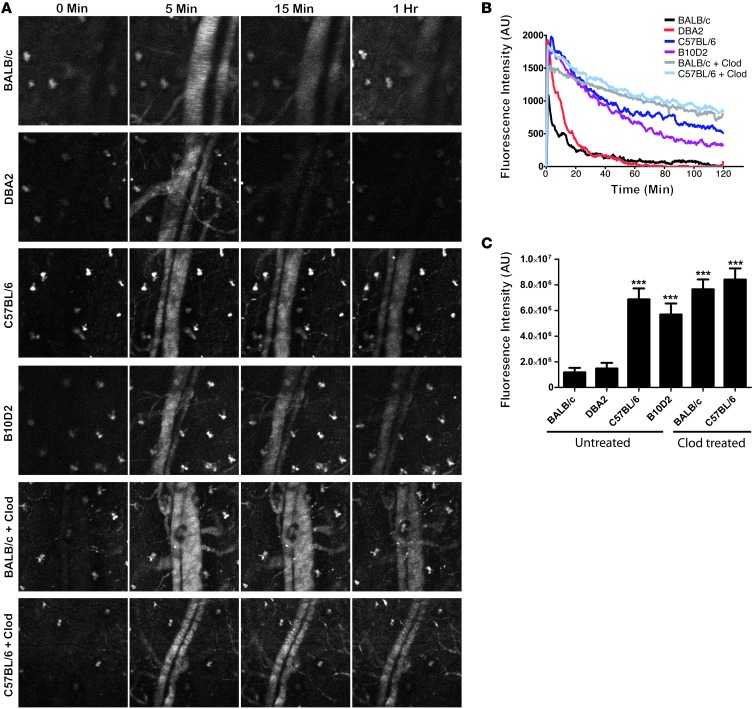
Figure 4. Th1 mouse strains clear nanoparticles slower than Th2 strains.
(A) Still images from Supplemental Videos 1–6 show the differences in particle circulation among the 4 mouse strains as well as the Clod-pretreated BALB/c and C57BL/6 mice. (B) Plots of fluorescence intensity versus time for all 4 mouse strains and Clod-treated mice (n = 4 mice per condition). (C) Plots of AUC for all conditions show a significant (P < 0.0001, 1-way ANOVA with Dunnett’s post test) increase in blood fluorescence in BALB/c and C57BL/6 and B10D2 mice, but not in DBA2 mice. Clod treatment significantly increases (P < 0.003, unpaired 2-tailed t test) blood fluorescence in BALB/c mice, but not in C57BL/6 mice.

