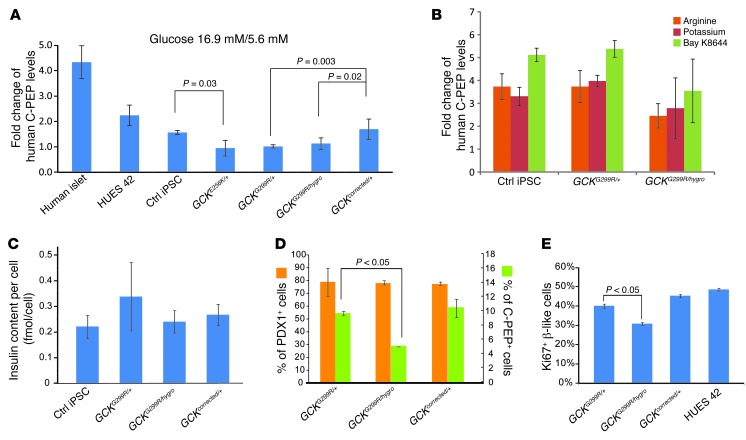
Figure 4. GCK gene dosage specifically affects glucose-stimulated insulin secretion.
(A) Fold change of glucose-stimulated insulin (C-peptide) secretion in human islets and control, GCK mutant, and gene-corrected cells in vitro. The basal condition was 5.6 mM glucose, and the stimulation condition was 16.9 mM glucose. Error bars represent standard deviation of 3 experiments. (B) Insulin (C-peptide) secretion in response to indicated secretagogues in vitro. (C) Insulin content of control cells and GCK mutant and gene-corrected cells calculated with total insulin content and numbers of insulin-positive cells. (D) Differentiation efficiency of GCK G299R mutant and gene-corrected cells. (B–D) Error bars represent standard deviation. (E) Proportion of in vitro–differentiated β cells (C-peptide positive) that were Ki67 positive. Error bars represent SEM (n = 20 replicates).

