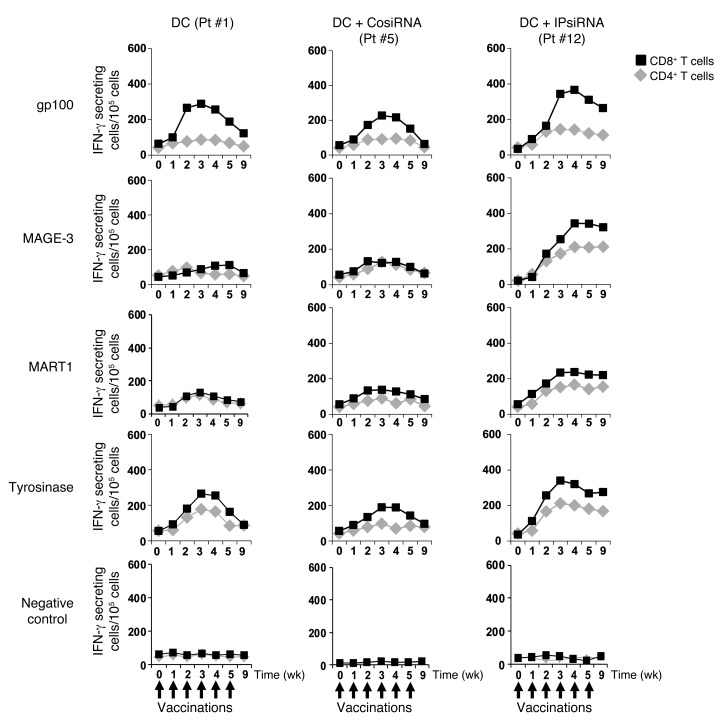
Figure 5. Kinetics of T cell responses to vaccination, as detected by IFN-γ ELISPOT.
The number of TAA-specific IFN-γ–secreting CD8+ and CD4+ T cells for each of the serially collected PBMCs samples of a representative subject from each study arm is graphed over time. Similar trends were noted for all 4 subjects in Arm A (DC), for the 3 subjects in Arm B (DC+CosiRNA), and for the 5 subjects in Arm C (DC+IPsiRNA) (see Supplemental Figures 2 and 3). Data represent mean ± SEM of duplicate measurements.

