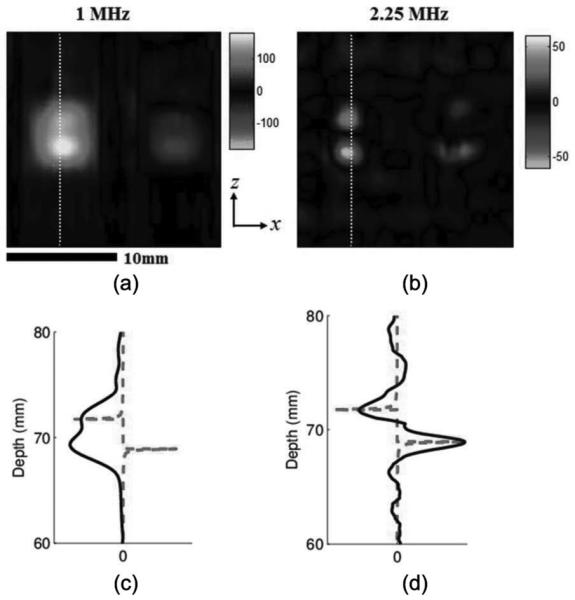
Fig. 3.

Effect of ultrasound frequency on ultrasound current source density imaging (UCSDI) (experiment): Color UCSDI B-mode images using two ultrasound transducers with different center frequencies: (a) 1.0 MHz and (b) 2.25 MHz. Colors represent amplitude and polarity of the acoustoelectric (AE) signal related to the electrical field distribution. Scale of color bars represents the amplitude of the measured signal in millivolts with a gain of 700. Solid curves in (c) and (d) are select filtered and basebanded A-lines denoted by dotted white lines in (a) and (b). The dashed curve in (c) and (d) is the z component of the electric current density distribution Jz.
