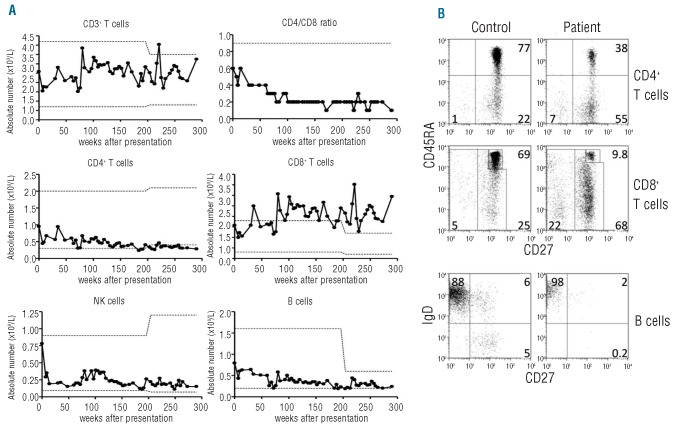
Figure 1.
Increased numbers and disturbed differentiation of CD8+ T cells. (A) Absolute numbers of total and CD4+ and CD8+ T cells, CD4/CD8 ratio, CD3−CD56+ NK cells and CD19+ B cells. Dotted lines indicate upper and lower limits of normal for corresponding age (changing at age 10 years), for CD4/CD8 ratio only the lower limit of normal is shown. (B) Distribution of naïve, memory and effector-memory T cells in both CD3+CD4+ and CD3+CD8+ T cells (i.e. CD45RA+CD27+, CD45RA−CD27+, CD45RA+or−CD27−, respectively), at 11 years of age compared to values in a 10-year old healthy control. Lower panels: B-cell differentiation (naïve, non-switched or class-switched memory, i.e. sIgD+CD27−sIgD+CD27+ or sIgD−CD27+).

