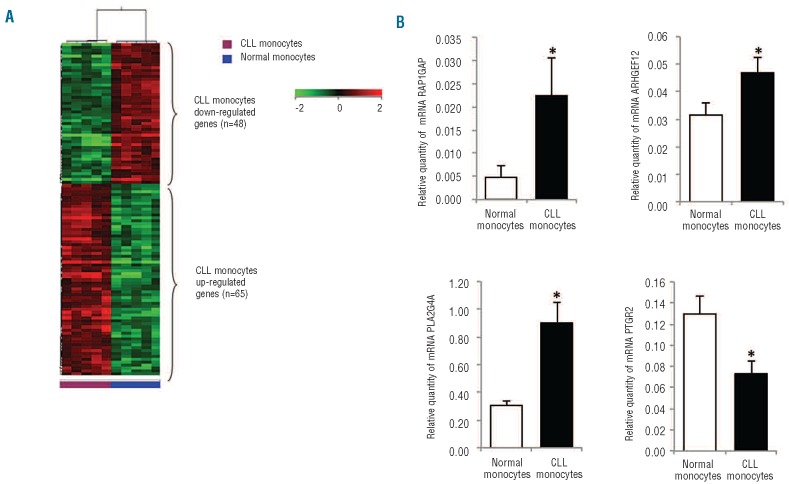
Figure 4.
Gene expression profiles of CLL-derived monocytes. (A) Heat map depicts differentially expressed genes between CLL-derived monocytes and normal monocytes. The data are represented in a grid format in which each column represents a case and each row a single gene. Normalized intensity signals are depicted in the pseudo color scale as indicated. (B) Histograms represent the mRNA relative quantity of RAP1GAP, ARHGEF12, PLA2G4A and PTGR2 evaluated by RT-PCR in monocytes obtained from 12 CLL patients and 13 healthy donors. (* P<0.05, Mann-Whitney test).

