FIGURE 1.
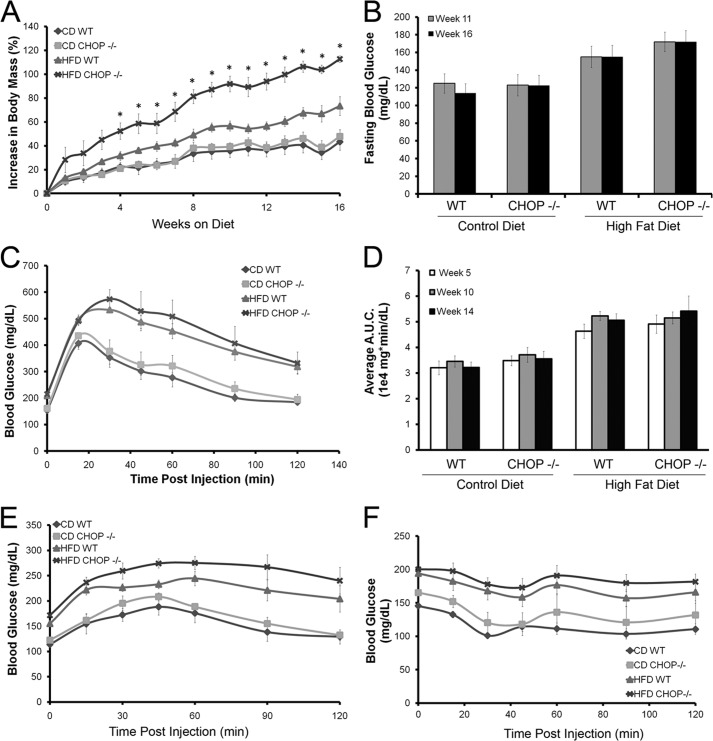
Metabolic characteristics of HFD-fed and CD-fed littermate CHOP wild type (Chop+/+) and knock-out (Chop−/−) mice (n = 5–6 per group). A, percent increase in body mass is shown for all four groups. Chop−/− HFD-fed mice demonstrated the greatest increase in body mass; this was significant at week 4 and remained significant for the duration of the study (*, p < 0.05). B, fasting blood glucose was measured at weeks 11 and 16. HFD-fed mice developed progressive hyperglycemia (p < 0.05, compared with CD-fed mice). No differences were observed between Chop+/+ and Chop−/− mice (p = not significant). C, shown are glucose disposal curves after intraperitoneal injection of glucose at week 14. HFD-fed mice developed progressive glucose intolerance. No differences were seen between Chop+/+ and Chop−/− mice. D, the area under the curve (A.U.C.) of the glucose tolerance test done at weeks 5, 10, and 14 demonstrated progressive glucose intolerance in the HFD-fed mice (p < 0.05, compared with CD-fed mice). No differences were observed between Chop+/+ and Chop−/− mice (p = ns). E, pyruvate tolerance testing done at week 15 showed enhanced hepatic glucose production among HFD-fed Chop+/+ and Chop−/− mice (p < 0.05, compared with CD-fed mice) without a genotypic difference between the two groups (p = ns). F, an intraperitoneal insulin tolerance test at week 16 demonstrated progressive insulin resistance in the HFD-fed mice (p < 0.05, compared with CD-fed mice) without genotypic differences between Chop+/+ and Chop−/− mice (p = not significant).

